
Figure 2.
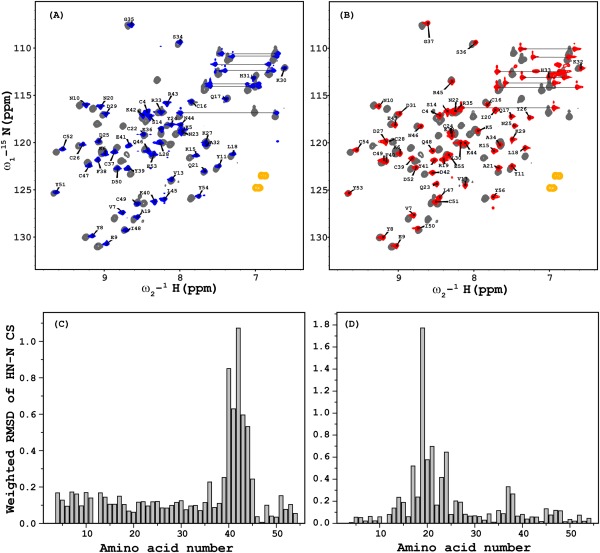
Overlay of 2D 1H‐15NHSQC spectra recorded on a Varian 600 MHz NMR spectrometer equipped with a cryogenic probe of (A) Brz‐D40K (blue) and Brz (gray) and (B) Brz‐ins18RI19 (red) and Brz (gray); the assigned amide resonances are labeled for mutants. Weighted rmsd chemical shift differences between the corresponding amide groups plotted against the corresponding amino acid number are shown for Brz‐D40K versus Brz (C) and Brz‐ins18RI19 vs.Brz (D). As expected, the largest chemical shift differences are observed at the amino acid substitution sites. The weighted rmsd was calculated using the formula ([0.5[Δδ(1HN)2+ (0.2 Δδ(15N))2]]1/2).