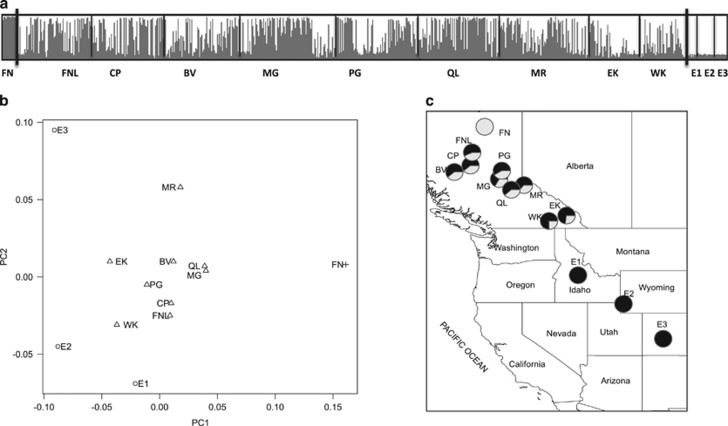
Figure 1.
Analysis of population structure in the P. glauca × P. engelmanni hybrid zone. (a) Posterior estimates of cluster membership for K=2 in TESS based on 10 SSR markers. Populations are ordered by decreasing latitude from left to right. Population names corresponding to two- or three-letter codes can be found in Table 1. (b) Plot of first two principal coordinates (PC1 and PC2) based on Nei's genetic distances among populations. Circles represent P. engelmannii populations; triangles, hybrid populations; and a cross, a pure P. glauca population. (c) Geographical distribution and degree of admixture for populations of P. glauca, P. engelmannii and their hybrids. Black circles represent P. engelmannii and gray circles, P. glauca populations. Bi-color circles represent hybrid populations.

