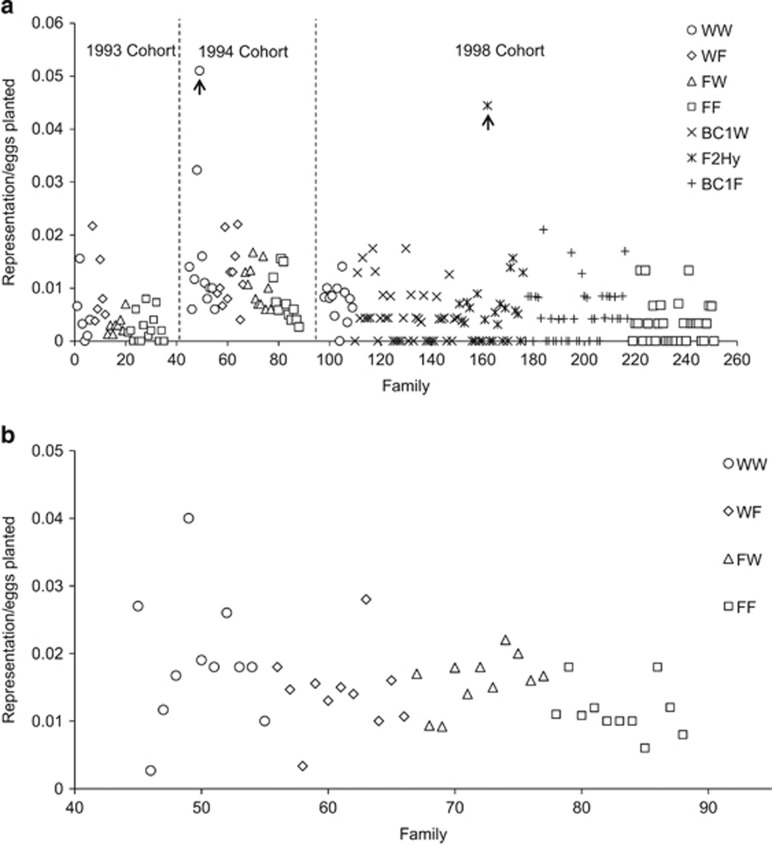
Figure 2.
(a) Representation of 0+ parr in the August electrofishing samples for the 1993, 1994 and 1998 cohorts, scaled by the number of eyed-eggs planted per family. (b) Representation (scaled by eggs planted) of 1+ parr in the June 1995 electrofishing sample for the 1994 cohort. Families are labelled arbitrarily in each panel and family labels for 1994 cohort correspond between (a) and (b). Arrows indicate outlier families.

