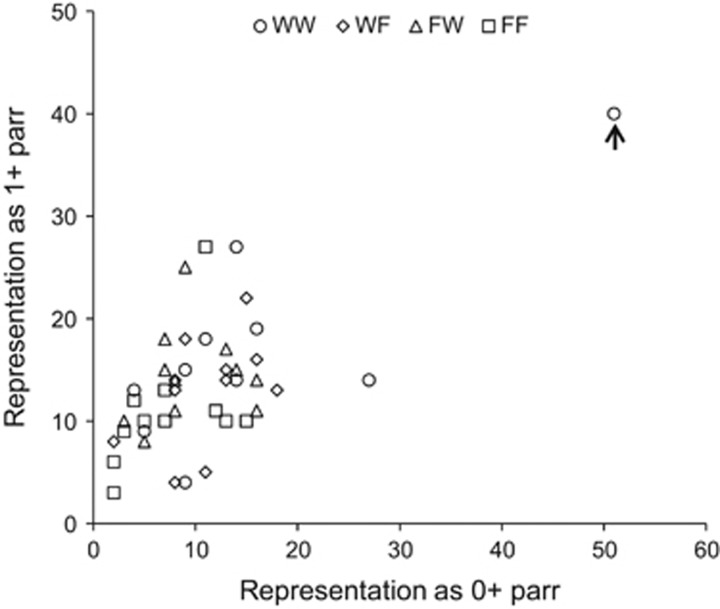
Figure 3.
Representation of 1+ parr in the June 1995 electrofishing sample plotted against representation of 0+ parr in the August 1994 electrofishing sample (1994 cohort). Each data point is a family. The outlier family indicated with an arrow is family 49, which corresponds to the same outlier family identified in Figure 2a.

