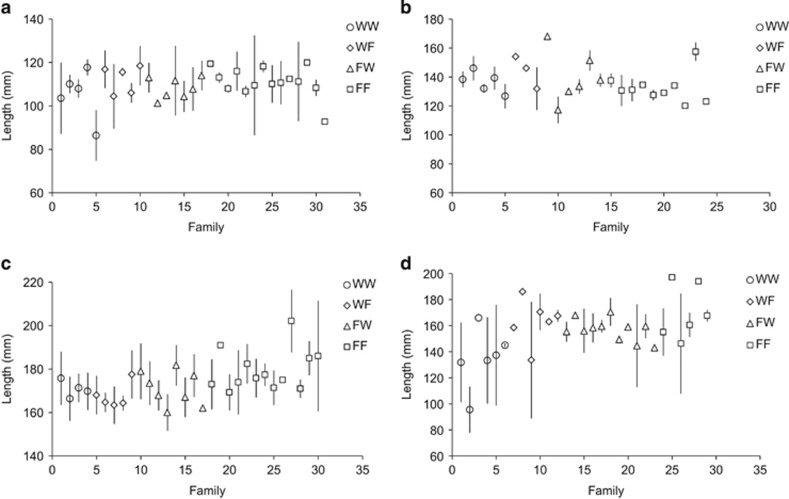
Figure 5.
Fork length of (a) 0+ parr in August 1993 hatchery control sample (1993 cohort), (b) mature male parr in November 1993 hatchery control sample (1993 cohort), (c) pre-smolts in March 1994 hatchery control sample (1993 cohort) and (d) pre-smolts in March 1995 hatchery control sample (1994 cohort). Error bars are s.d. around the mean per family.

