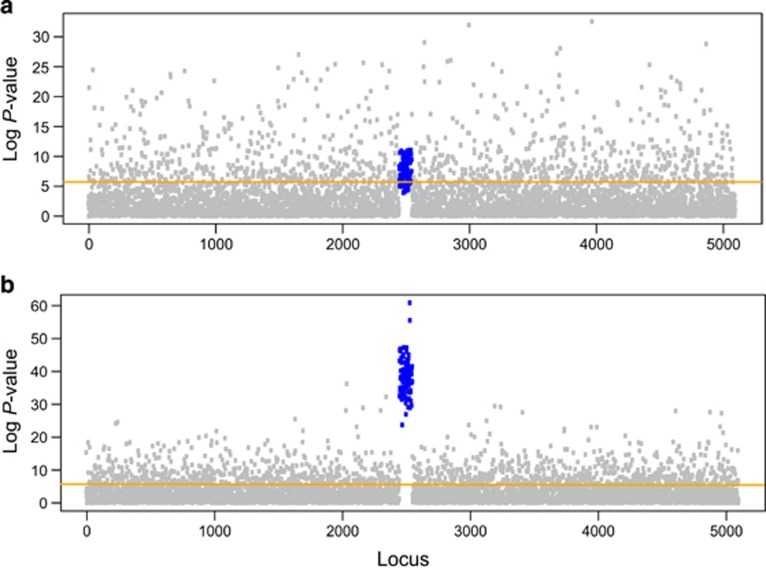
Figure 3.
Manhattan plot for linear model association tests under two distinct angles of selection gradient (0 and 90 degrees). Graphical representation of minus log10 P-values of linear regression tests at each locus. The horizontal line represents the value of the Bonferroni correction threshold. P-values for (a) ecological gradients perpendicular to the direction of expansion and (b) parallel to the direction of expansion.

