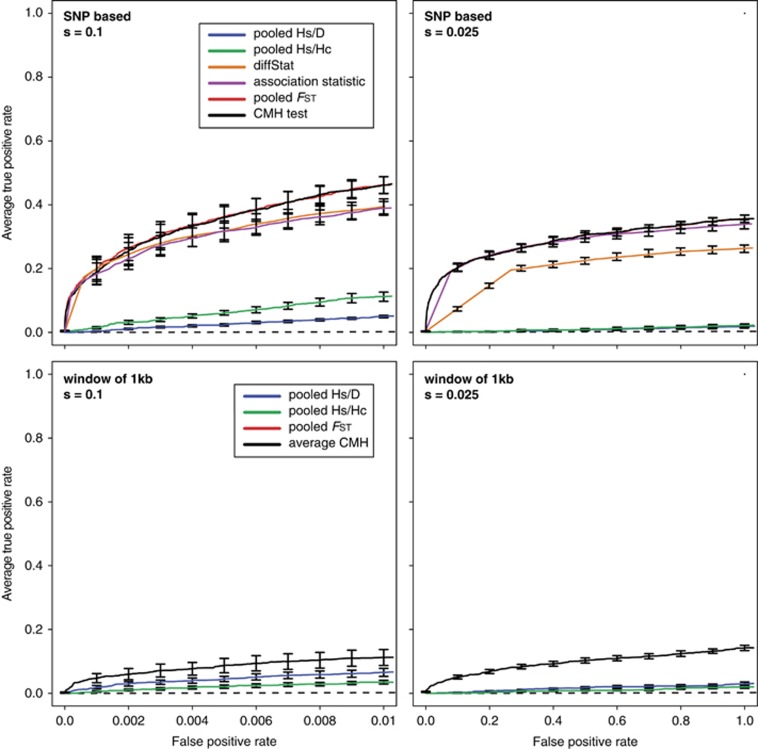
Figure 2.
Performance of different test statistics used in E&R studies. Receiver operator characteristic (ROC) curves that contrast the true positive rate with the false positive rate. We extended the results of Kofler and Schlötterer (2014) by including the pooled Hs/D test, the pooled Hs/Hc test and the pooled FST test (Remolina et al., 2012). Briefly, Kofler and Schlötterer (2014) simulated E&R with a base population that captures the pattern of polymorphism in a natural D. melanogaster population. They simulated 60 generations of selection with a population size of 1000 and 3 replicates. Results are shown for SNP-based analysis (top graphs) and for a window-based (bottom graphs) analyses using either 150 strongly (left graphs) or 150 weakly (right graphs) selected loci. The behavior of the Cochran–Mantel–Haenszel (CMH) and pooled FST tests are very similar, resulting in largely overlapping curves. We note that this comparison is mainly for illustrative purpose and it may be that different evolutionary scenarios change the behavior of the test statistics. A full color version of this figure is available at the Heredity journal online.

