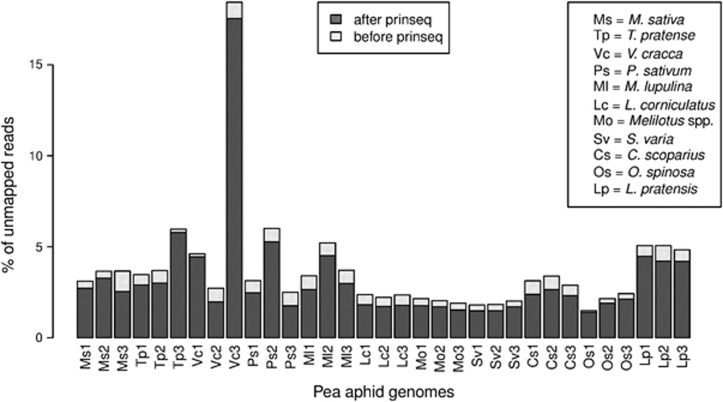
Figure 2.
Percentage of unmapped reads (unmapped by pair) for each individual, after and before cleaning for quality. Individuals are grouped by biotype and sorted according to their known divergence with respect to the reference genome, the most divergent ones being at the right side of the figure.

