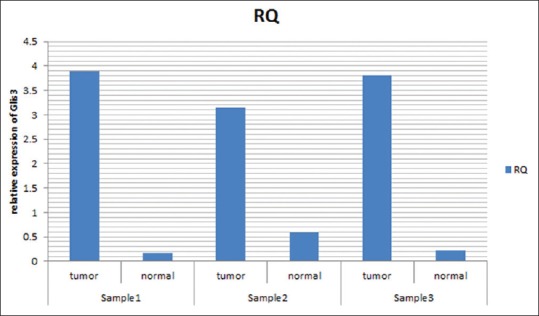
Figure 1.

The relative expression of GLIS3 gene in tumor and normal breast tissues (ductal tissue samples). The figure shows the ΔCT in 3 of our samples (both of tumor and normal samples obtained from one patient indicated as paired charts). The RQ means relative quantity of GLIS3 gene expression in comparison to its control gene (GAPDH) in each sample that indicates the increased level of GLIS3 gene expression in tumor samples in comparison to normal samples
