Figure 1.

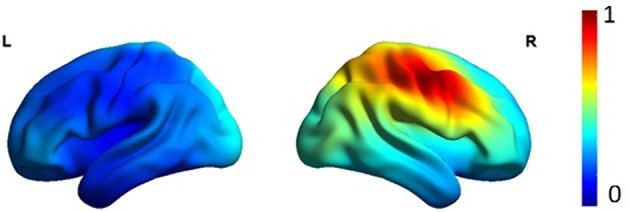
Average eLORETA source localization of interictal spikes in patients. The squared magnitude of the current density is color coded from dark blue (zero) to dark red (one).

Average eLORETA source localization of interictal spikes in patients. The squared magnitude of the current density is color coded from dark blue (zero) to dark red (one).