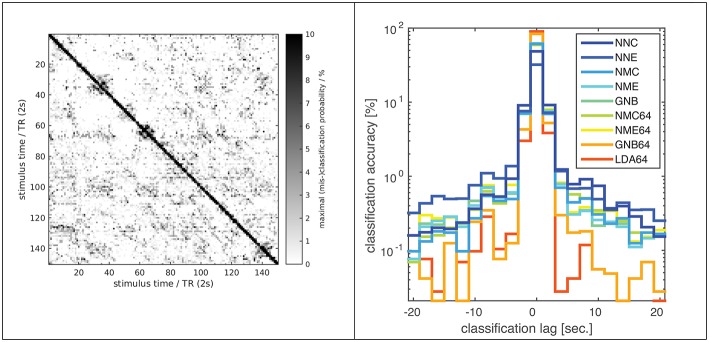
Figure 3.
Classification error distribution in time. A confusion matrix (left) of (mis-)classification rates between training and validation stimuli (x/y axes) averaged over all subjects, experiments and classifiers (based on the optimal input fROI of 214 voxels) and the corresponding (mis-)classification lag histogram (right) of the same data both illustrate that most mis-classifications fall within ±1 TR (2s) of the correct target simulus (i.e., the diagonal = lag zero; Classifier labels NNC, NNE, etc. refer to Table 1). The known hemodynamic lag of the BOLD signal offers an obvious explanation, but the visible block-diagonal structure (left) implicates the compounding effect of perceptual similarity between stimuli. Some blocks of high similarity apparently correspond to scenes of fast motion or prominent faces in the movie stimulus.

