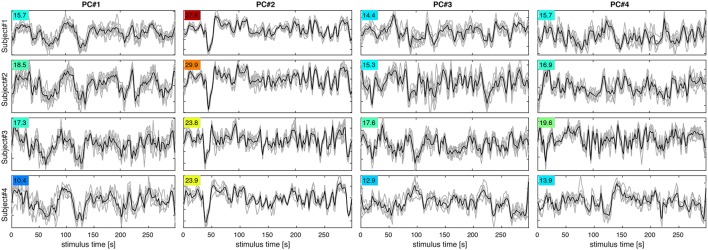
Figure 5.
PC signal time courses for PC#1–4 (columns) in subjects 1–4 (rows). Each panel shows PC signals for eight experimental runs (gray) and their mean (black). The F-statistic (colored numbers) quantifying signal over noise variance for each set of curves indicates, which PCs are most reproducible and likely to contribute to classification success.

