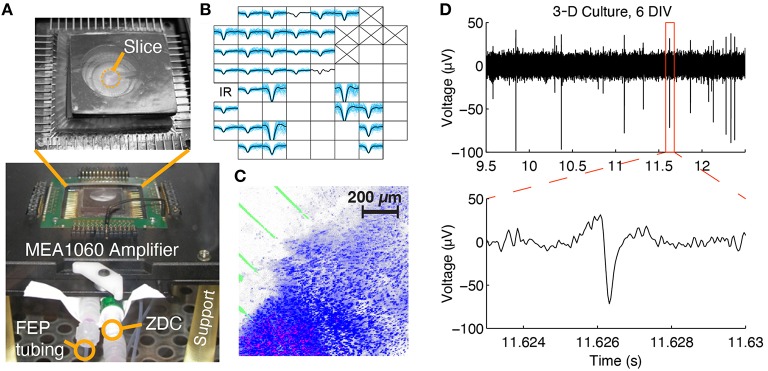
Figure 3.
Multi-channel electrophysiological recording and confocal imaging of perfused slice cultures. (A) A perfused slice is shown on a pMEA seated in 60-channel preamplifier. The FEP tubing, zero-displacement connector (ZDC), and support legs can be seen. (B) Example spontaneous spike waveforms recorded from a slice at 1 DIV during a 2 min recording (blue: individual spikes, black: average waveform). Each plot box represents one channel and the boxes are arranged according to the array geometry. Each plot has a horizontal limit of −400 to 600 μs from the spike trough and a vertical limit of −100 to 50 μV (some waveforms have been clipped so that smaller waveforms are still visible). Channels marked with an “X” were sacrificed to create the medium withdrawal port and blank channels had no spikes. (C) Confocal 3-D rendering of a perfused brain slice seated in the perfusion chamber at 1 DIV. Blue: Hoechst 33,342 dye, stained all cell nuclei; Red: Propidium Iodide, stained dead cell nuclei; Green: electrode traces. (D) Raw voltage trace containing spikes recorded from a 3-D culture at 6 DIV.

