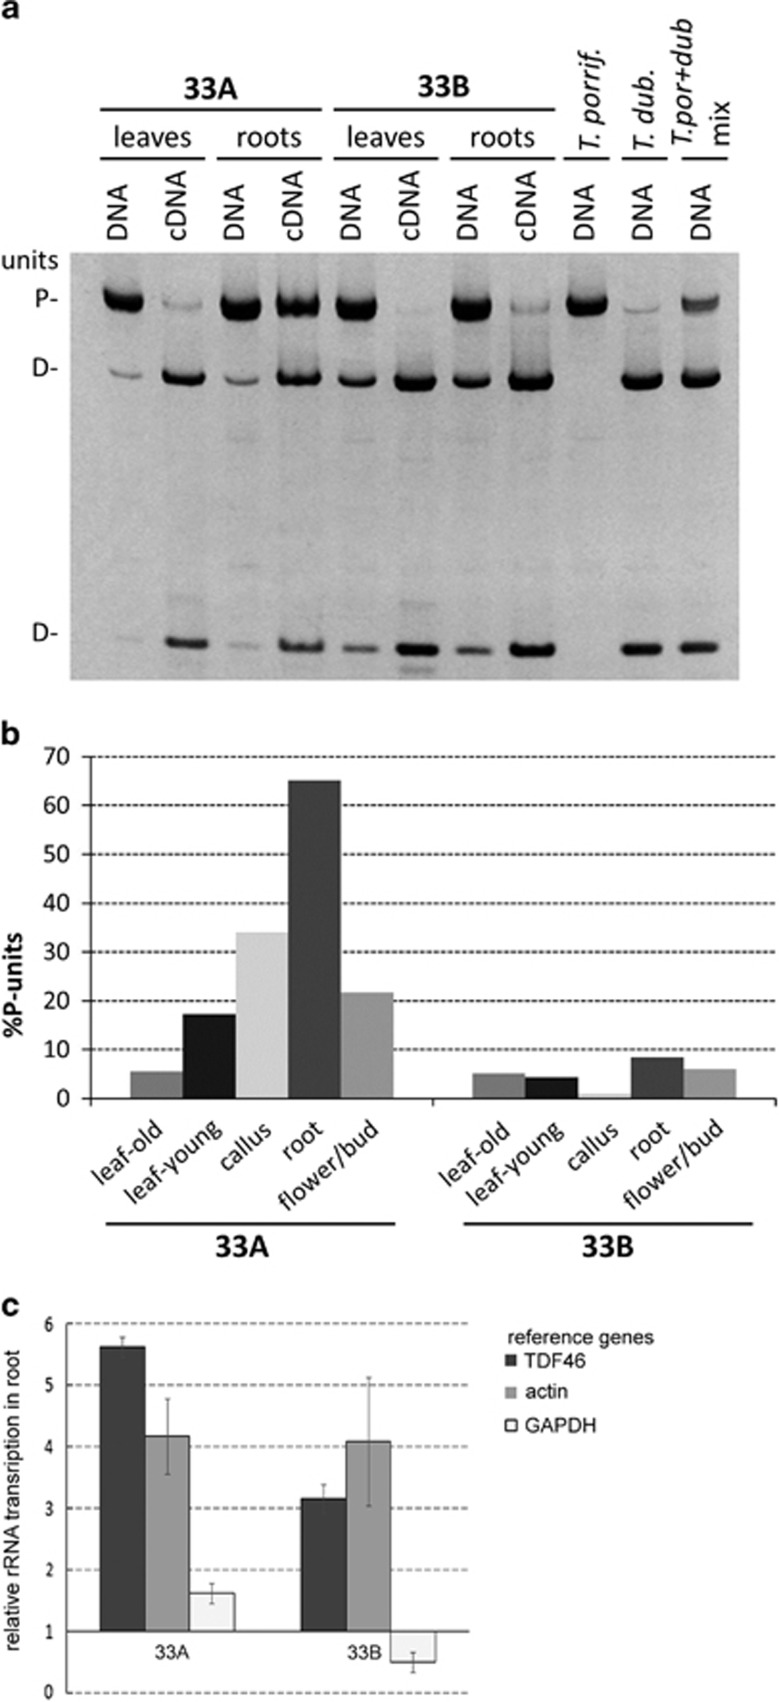
Figure 4.
Stability of nucleolar dominance in different tissues. (a) Genomic CAPS (DNA) and cDNA CAPS (cDNA) analysis in T. mirus plants 33A and 33B. (b) Band intensities from cDNA CAPS analysis were used to quantify the relative abundance of P-genome transcripts. Note how P-genome type units are transcriptionally active in some tissues of plant 33A. (c) relative rRNA expression in leaf and root. The levels of rRNA precursors were compared with the TDF46, GAPDH and actin reference genes. Expression in leaf was set to ‘1'. Averages from three biological replicates are presented.

