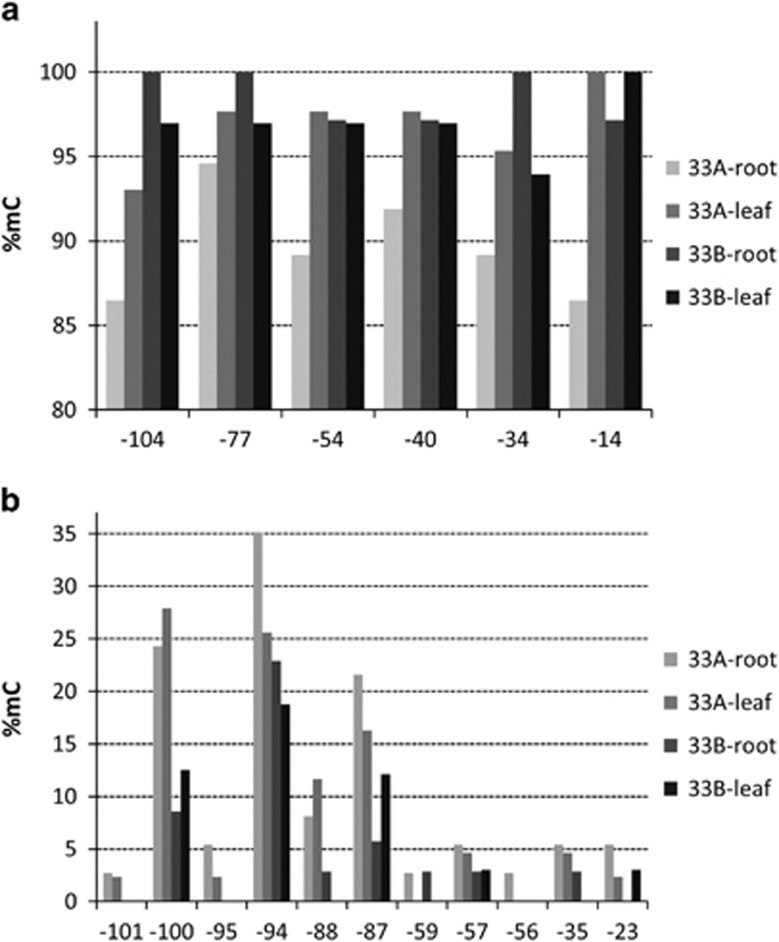
Figure 5.
Methylation levels of C's in the P-genome promoter. The −105/+5 region was analysed. The horizontal axis shows the position of C's (a) in the symmetric CG and CHG contexts and (b) the non-symmetric CHH context. Note: (a) that the level of cytosine methylation at symmetric C's differs significantly between roots and leaves of plant 33A (Supplementary Table S6, Wilcoxon signed-rank test, P<0.05); and (b) that the level of cytosine methylation at non-symmetrical positions differs significantly between plants 33A and 33B (P<0.05).

