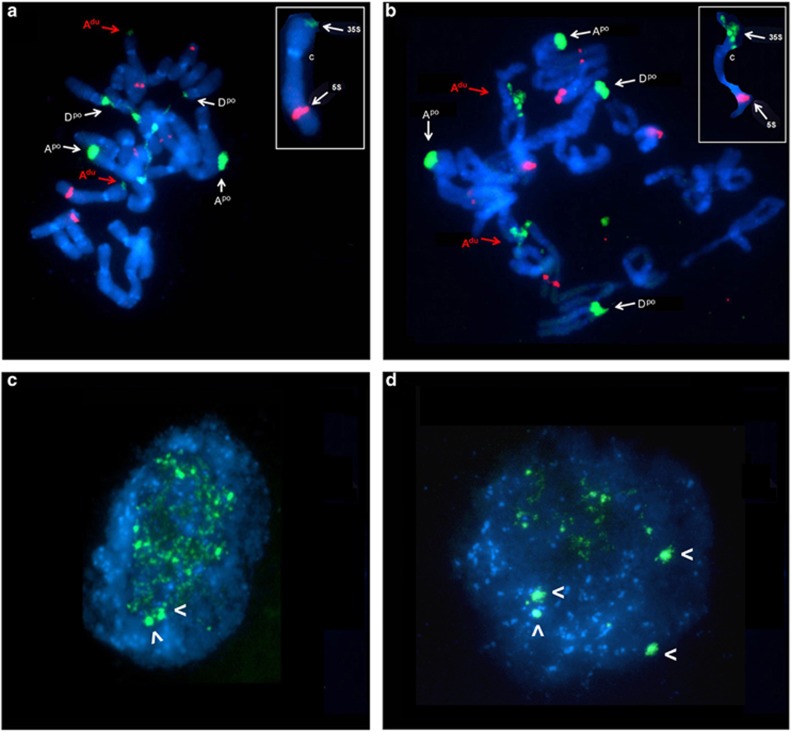
Figure 6.
Cytogenetic characterisation of rDNA condensation patterns in T. mirus plants 33A (a, c) and 33B (b, d). FISH with 35S rDNA (green signals) probe to root-tip metaphase (a, b) and interphase (c, d) chromosomes counterstained with DAPI (blue). The red fluorescent signals originate from 5S rDNA hybridisation (a, b). The red arrows show the 35S rDNA locus on chromosome Adu from D-genome and white arrows to loci on chromosomes Apo and Dpo from P-genome. Note in (a) the extended secondary constrictions reflecting decondensed rDNA at the Dpo chromosome locus only. Inset shows an enlarged Adu chromosome showing the small size of the 35S rDNA signal. Note in (b) that the rDNA locus on chromosome Adu is larger in plant 33B than in plant 33A and is also decondensed, probably reflecting its transcriptional activity. The position of the centromere is marked as C. Chromosome nomenclature follows Pires et al. (2004). In interphase, there were two and four heterochromatic rDNA knobs (arrowheads) in plants 33A (c) and 33B (d), respectively.

