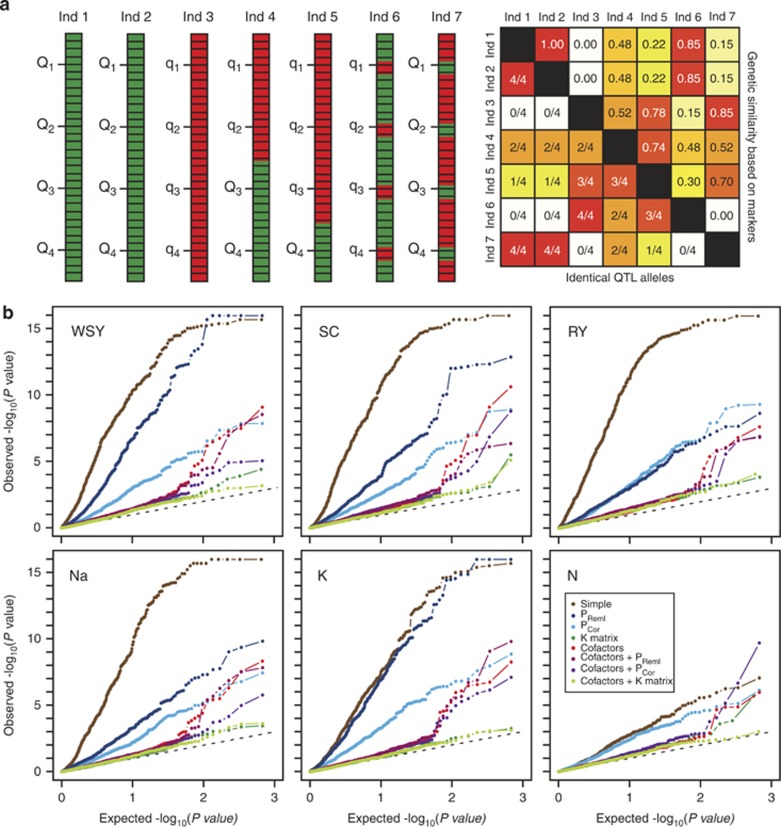
Figure 1.
(a) Schematic illustration of the information captured by a kinship matrix. Seven individuals with a single chromosome are shown harboring four QTL with two alleles (Q, q). The horizontal lines indicate markers and red and green indicate different alleles at the marker loci. The heatplot indicates genetic similarity among the seven individuals estimated based on marker information (above diagonal) and their identity at the four QTL (below diagonal). (b) Distribution of observed −log10(P-values) against expected −log10(P-values) for the different biometric models shown for six traits.

