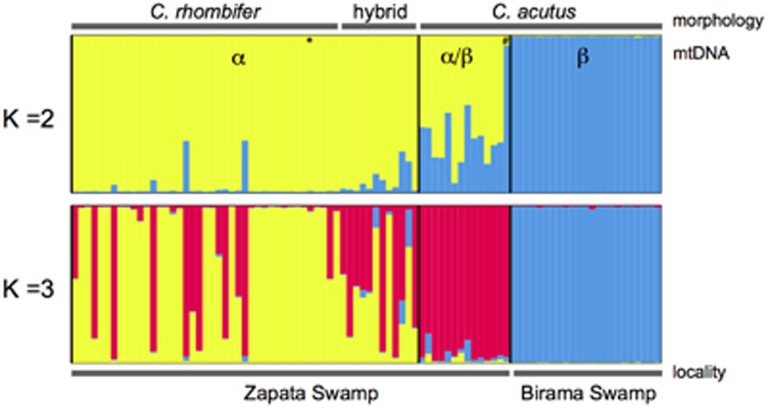
Figure 3.
STRUCTURE bar plots depicting the model-based clustering results for inferred K=2 and K=3. Inferred genetic clusters are displayed as different colours. Each bar on the x axis represents an individual, with the y axis displaying the proportion of membership in each genetic cluster. Morphological identification as C. rhombifer, C. acutus or hybrid is indicated at the top, and sampling locality (Zapata Swamp or Birama Swamp) at the bottom. Recovered mtDNA haplotypes, including α and β, are superimposed on the plot, with black vertical lines indicating the boundaries. Individuals possessing rare haplotypes are indicated by * for haplotype D and # for haplotype C. A full color version of this figure is available at the Heredity journal online.

