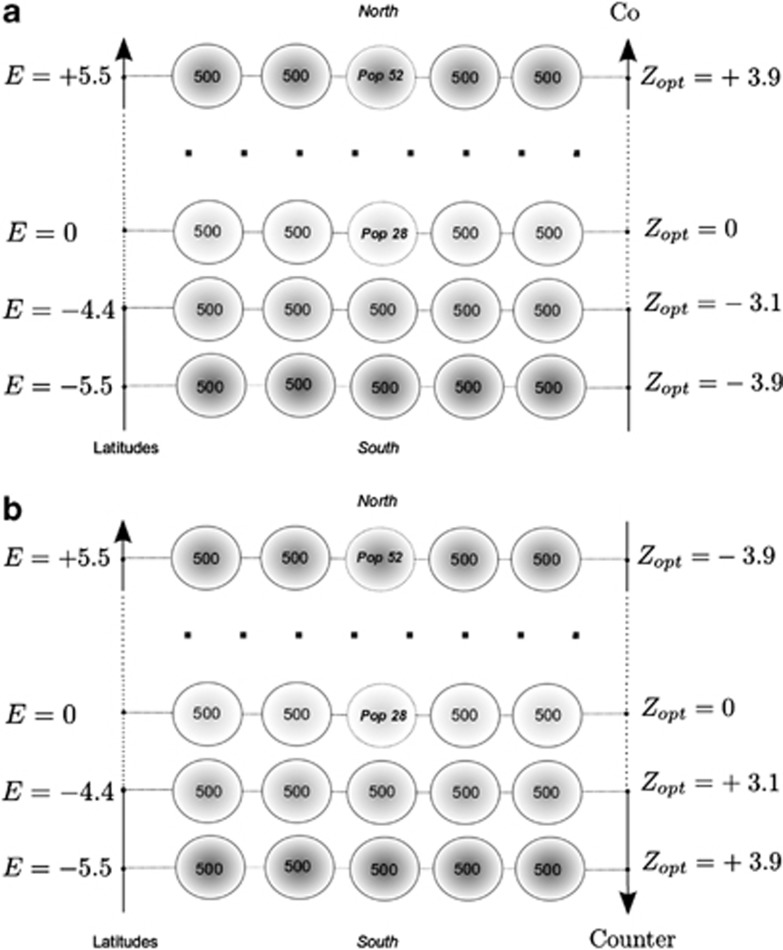
Figure 1.
Spatial settings of populations, environmental and selection gradients. Fifty-five populations of 500 individuals each were spread homogeneously on a 5 × 11 grid along 11 latitudinal positions. E represents the environmental effect at a given latitude (see Soularue and Kremer (2012) for more details). Co- and countergradient divergent selection were mimicked by assigning different Zopt values at different latitudes. In the cogradient case, Zopt values are positively correlated to latitudes, as the E values. In countergradient settings, Zopt values are negatively correlated to latitudes, and hence are negatively correlated to the E values. Both examples correspond to kE=2 and to  . We considered mostly cases with ω2=50 and
  , some cases were explored with ω2=5 or
  . Finally, uniform selection was simulated with
  .
.

