Figure 5.
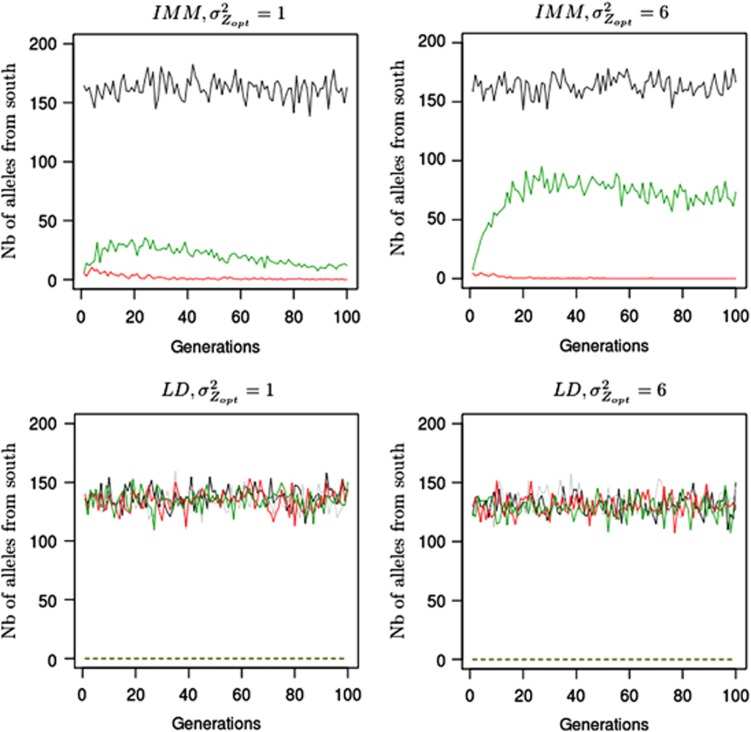
Amount of southern immigrant alleles received by a northern population over generations. Absolute number of immigrant alleles into a population located at the extreme northern latitude (pop 52) and coming from southern latitudes (−0.5 to −0.1). Only gene flow between populations is represented here. Numbers on the y axis are counts of alleles at a given generation (x axis). Counts of alleles were monitored for two distinct selection gradients ( ,
,  ), three models of pollen dispersal (IMM, LDS and LDN) and two mating systems (assortative or random mating). Title of the figures indicates the steepness of the selection gradient and the dispersal model simulated. LD means that the pollen dispersal in the scenario is of ‘long-distance and directional' type, it refers both to LDN (plain line) and LDS (dashed line). The color lines indicate assortative mating (ρ=0.8), red standing for cogradient and green for countergradient directional selection. The black and gray lines stand for random mating with the selection gradient covarying positively or negatively with latitudes, respectively. However, because under random mating the direction of the selection gradient has no impact when combined with IMM, the latter case was only considered when directional dispersal models were simulated (LD with
  and LD with
  ). Each line represents the mean of 30 independent replicates for each evolutionary scenario.

