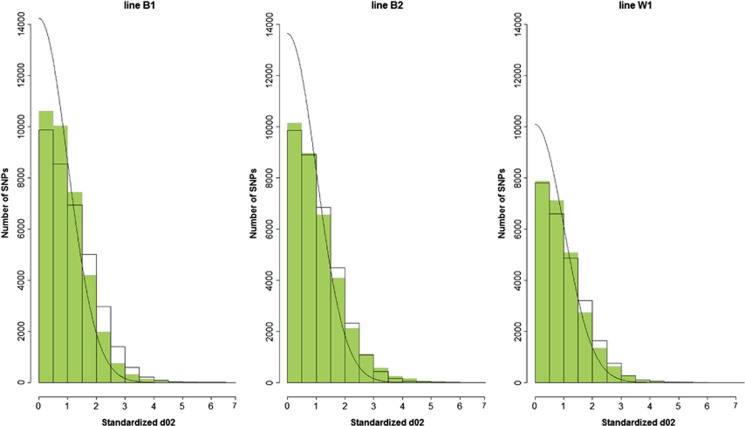
Figure 5.
Distribution of standardized d02 (standardized based on drift s.d.) across all loci after two generations of selection of GBLUP (green bars) or BLUP (transparent bars). On the x axis, standardized d02 values are plotted and the number of SNPs is displayed on the y axis. The black solid line shows the expected variance of allele frequency changes under pure drift (SDt=1).

