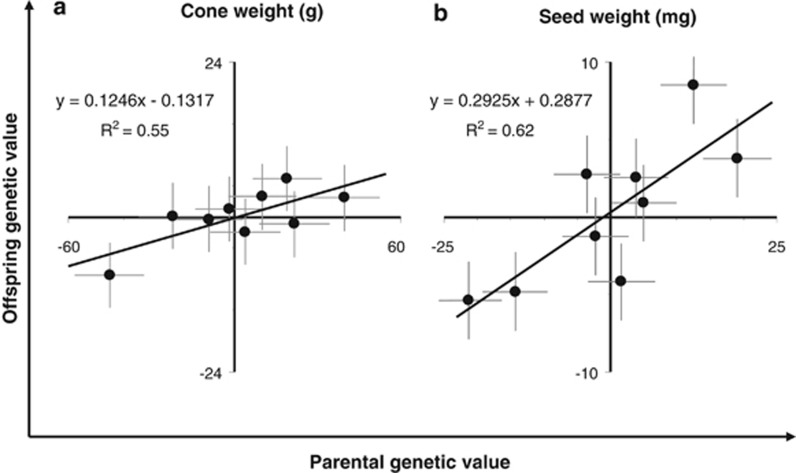
Figure 3.
Parent–offspring regression for cone weight and SW mean of Pinus pinaster. Each point represents the BLUP of the parental value and the offspring value as obtained from the analysis of two clonal seed orchards (parents) and two half-sib progeny trials (offspring). N=9 parental genotypes and 9 half-sib families. Error bars denote the standard error of the corresponding BLUPs.

