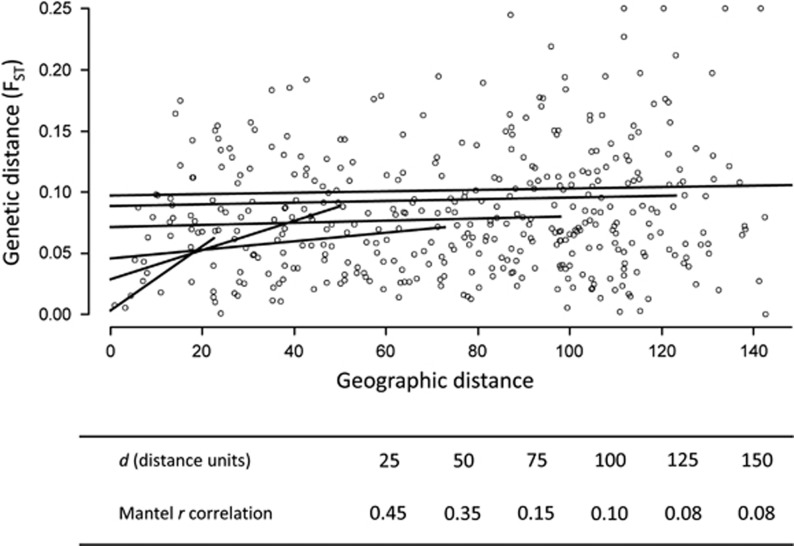
Figure 3.
Demonstration of how the distance of DMC was calculated. From plots of pairwise genetic (FST) and geographic distances, we selected deme pairs with an interdeme distance up to a maximum distance d. For each selection of deme pairs, we then calculated the Mantel r correlation coefficient between geographic distance and FST. Correlation trend lines belonging to different d values are shown in black. In the table, we show the correlation coefficients calculated for a series of d-values. In the present example, DMC would be 25, as d=25 resulted in the highest FST–distance correlation (that is, Mantel r correlation=0.45).

