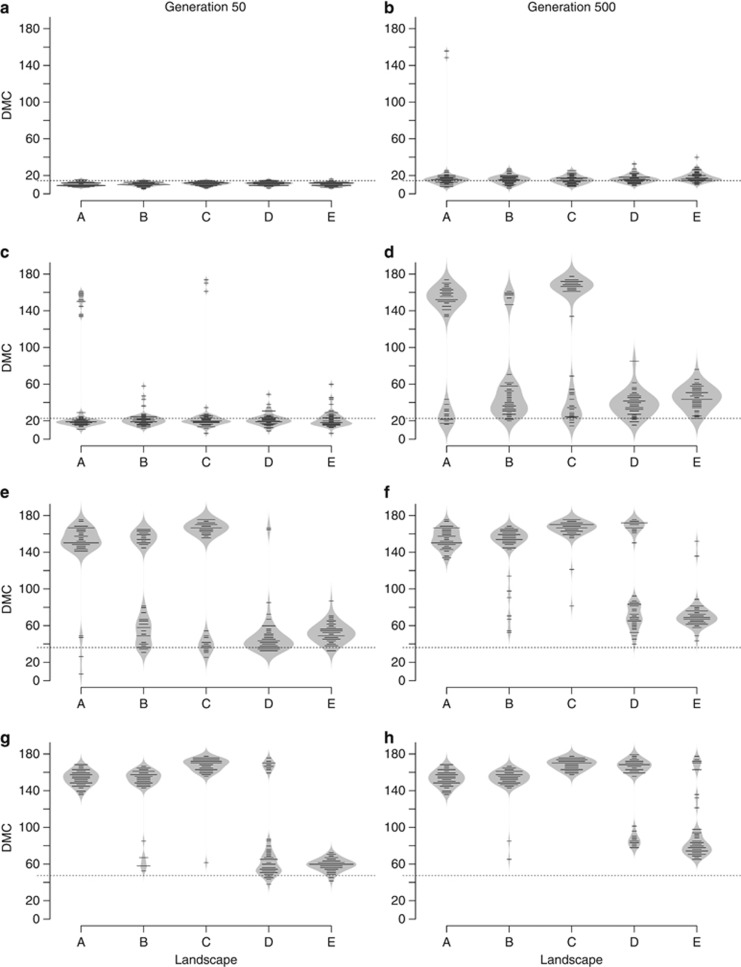
Figure 4.
Bean plots showing the distance of DMC for five different neutral landscapes (Figure 2) and a range of MMD at generations 50 (a, c, e, g) and 500 (b, d, f, h). Gaussian migration probability functions were used in these simulations. The length of the black lines in a bean plot indicates the number of times a certain DMC was scored from the 50 random topologies of 100 demes. Similarly, the grey areas of the bean plot show the smoothed frequency distributions of observations at different DMC values, analogous to a mirrored histogram. The dashed lines indicate the MMD, at which the migration probability from a Gaussian migration function with a certain variance equalled 0.0001. We tested four MMDs: 14.4 (a, b), 22.7 (c, d), 36.1 (e, f) and 47.4 (g, h). A peak in the DMC distribution just below or above the MMD indicates a case-IV FST–distance relationship (Figure 5a; Hutchison and Templeton, 1999), whereas a peak in the DMC distribution between 140 and 170 distance units indicates a case-I relationship (Figure 5b; Hutchison and Templeton, 1999).

