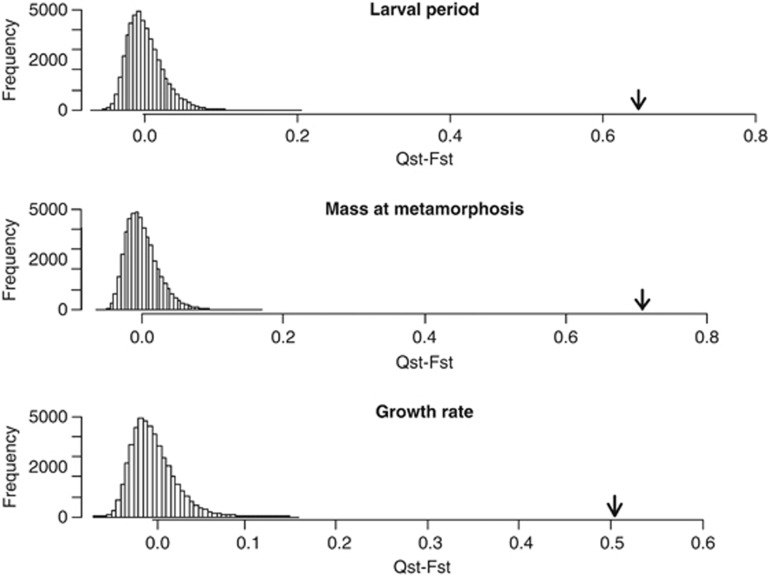
Figure 3.
QST–FST comparison for the life-history traits measured: larval period, mass at metamorphosis and growth rate. The arrows indicate the point estimate for the difference between both statistics (QST–FST). Histograms represent the distribution of the 50 000 simulated (QST–FST) values for a neutral trait.

