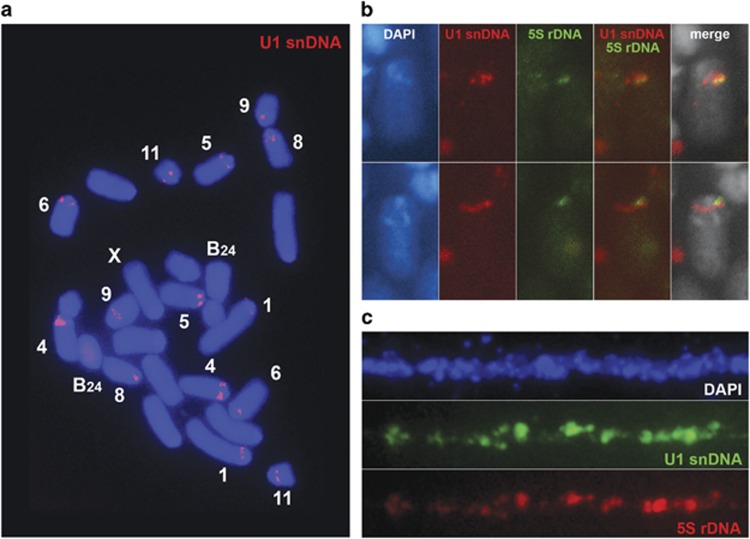
Figure 7.
FISH analysis for U1 snDNA (a–c) and 5S rDNA (b and c) in E. plorans chromosomes. (a) Mitotic metaphase, (b) selected chromosomes (pair 6) from a mitotic metaphase and (c) fiber FISH. Note the spread distribution for U1 snDNA on the chromosomes (a) and the colocalization (interspersed organization) of U1 snDNA and 5S rDNA (b and c). A full color version of this figure is available at the Heredity journal online.

