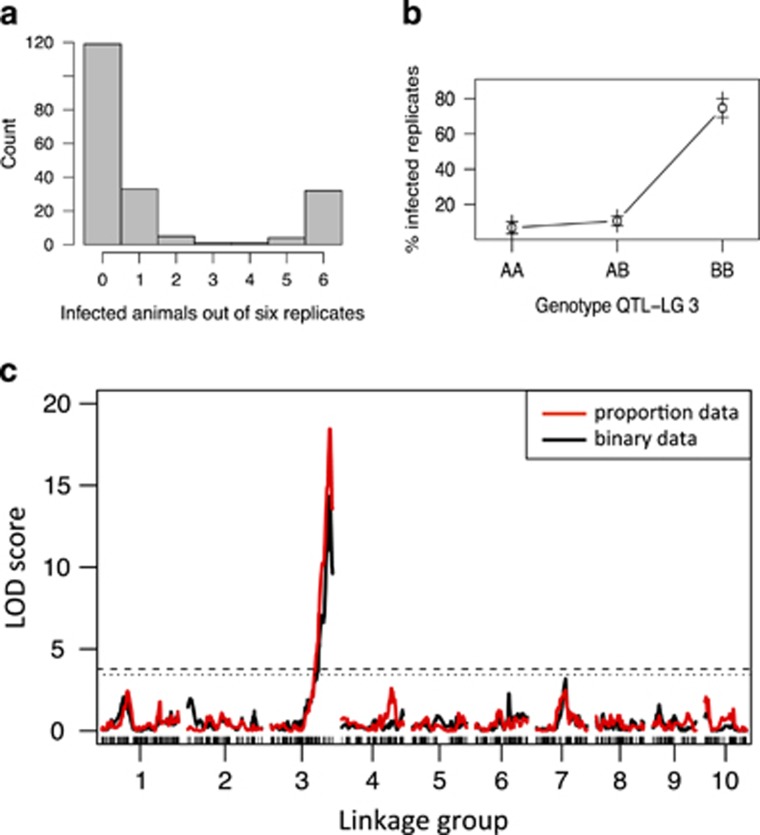
Figure 1.
Analysis of infection data for D. magna after exposure to P. ramosa. (a) Frequency distribution showing the number of infected replicates (of six total) for 195 F2 clones. (b) Effect plot (means±s.e.) for the three genotypes at scaffold00288_965 on lg 3 for the infected replicates. A alleles are from the resistant German parental clone; B alleles are from the susceptible Finnish parental clone. (c) QTL mapping for resistance against Pasteuria. Black solid lines indicate the analysis with the proportion data; the red line shows the analysis with binary coded data; dashed lines show the LOD threshold for significance (dashed line: P<0.05; dotted: P<0.1).

