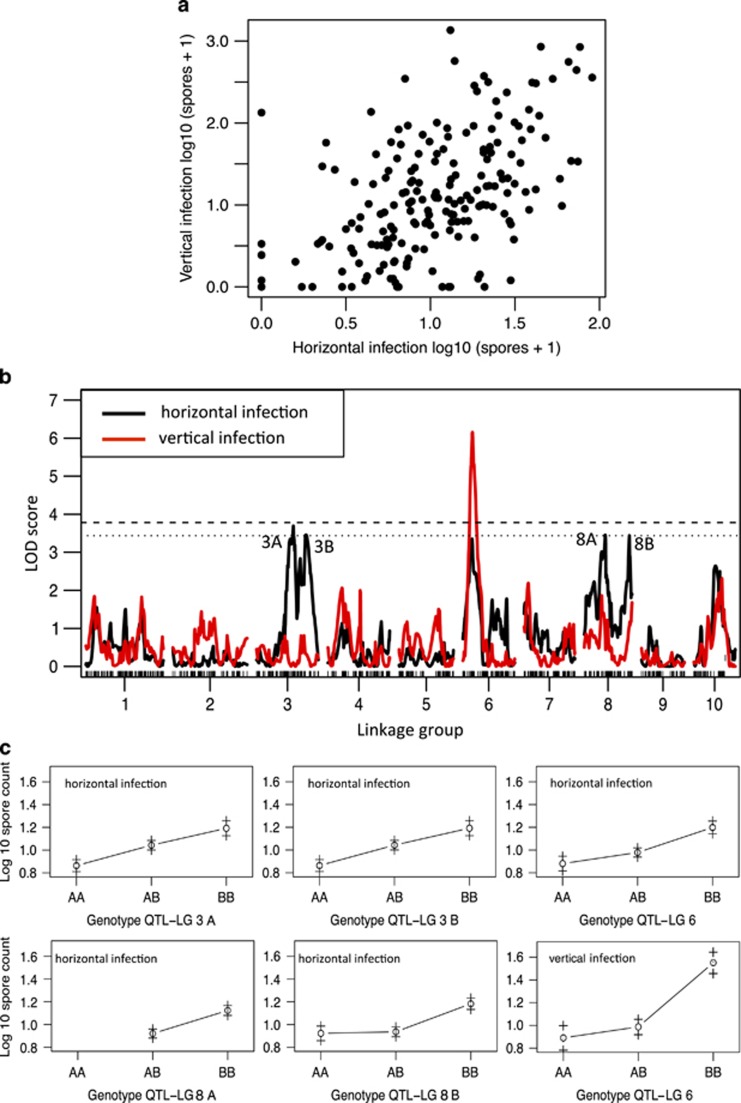
Figure 2.
Analysis of infection data for D. magna after exposure to H. tvaerminnensis. (a) Scatter plot of mean clonal spore counts for vertically infected versus horizontally infected animals (both traits log10(spore count+1) transformed). (b) QTL mapping of H. tvaerminnensis log10(spore count+1) in horizontally infected (black line) and vertically infected (red line) hosts. Dashed lines show the LOD threshold for significance (dashed line: P<0.05; dotted: P<0.1). Five QTLs are detected in horizontally infected hosts. One QTL is detected for vertically infected hosts, colocalized with a QTL for horizontal infections on lg 6. (c) Effect plots (means±s.e.) for genotypes at the identified QTLs. A alleles are from the resistant German parental clone; B alleles from the susceptible Finnish parental clone. Multiple QTLs on lg 3 and lg 8 are indicated with letters A and B. The effect plot for marker contig29113_349 (lg 8A) has no AA genotypes shown, because we had only phenotypic data for a single AA genotype. This region of the map showed strong transmission ratio distortion due to an infertility allele (Routtu et al., 2010).

