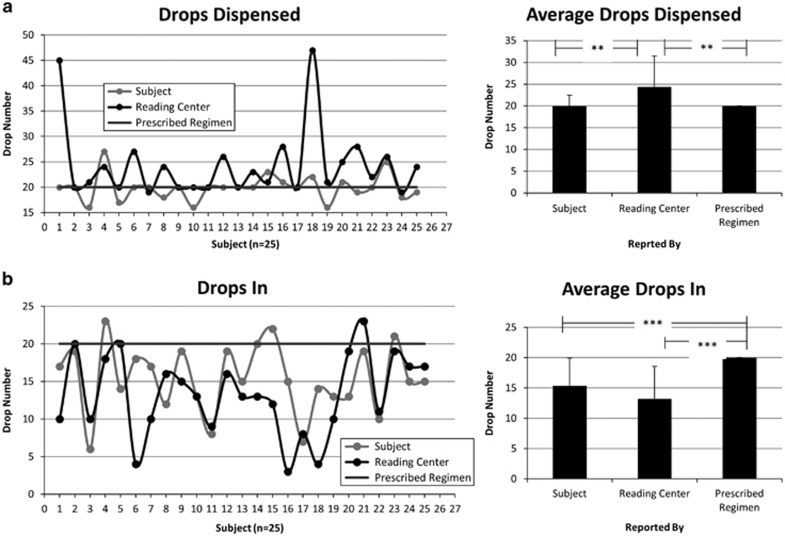
Figure 2.
In-clinic comparison of the number of Drops dispensed and how many landed in the eye. (a) Shows the log book comparison between the actual number of drops dispensed for each subject during the in-clinic phase and the average number of drops dispensed. Bars denote SD, **P<0.005 (n=25, Student's paired t-test). (b) Shows the log book comparison between the actual number of drops that landed in the eye for each subject during the in-clinic phase and the average number of drops that landed in the eye. Bars denote standard deviation; ***P<0.001 (n=25, Student's paired t-test).

