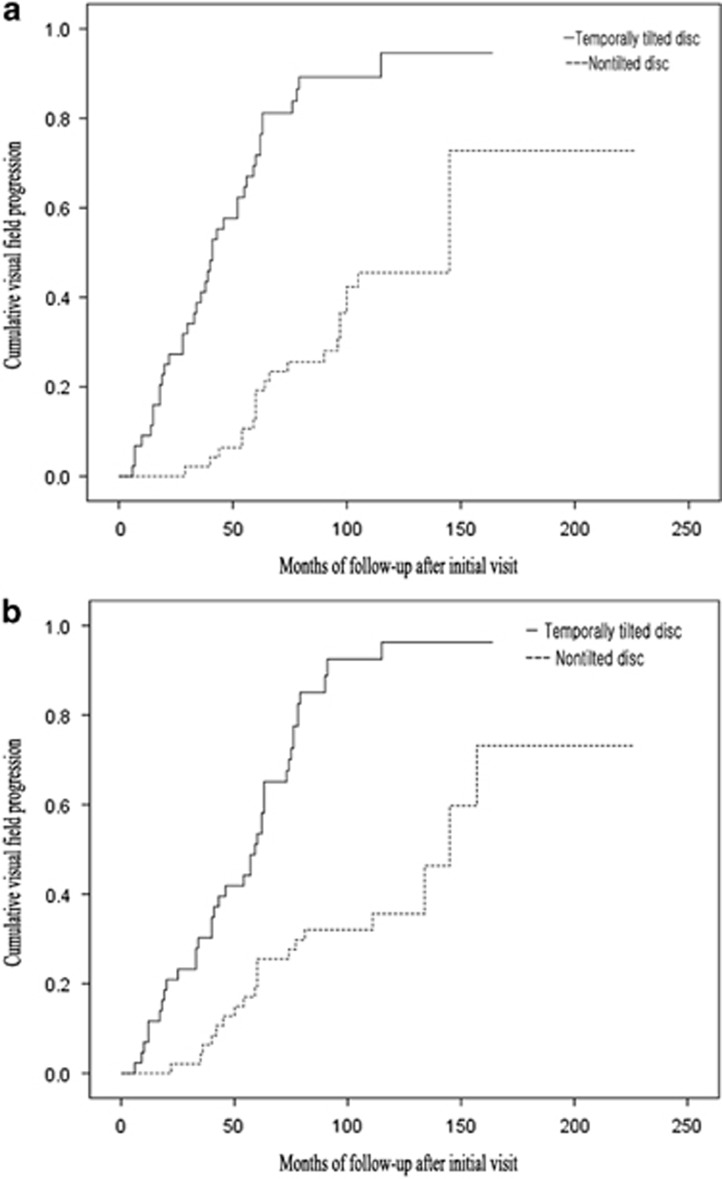
Figure 1.
Kaplan–Meier survival plots of probabilities of visual field progression. The visual field progression was defined using two methods. Modified Anderson–Hodapp criteria (a) and Glaucoma Progression Analysis (GPA) software (b). According to the modified Anderson–Hodapp criteria, the progression rates of the two groups at 60 months were 19% in group 1 and 72% in the group 2 (P<0.0001, χ2-test). According to the GPA, the progression rates 60 months after initial visit were 25% in group 1 and 53% in group 2, respectively (P<0.0001, χ2-test; temporally tilted disc: group 1, nontilted disc: group 2).

