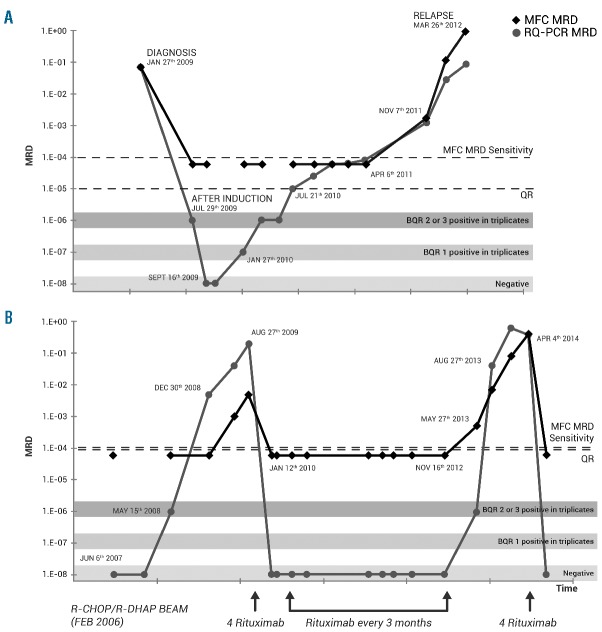
Figure 7.
Kinetics of minmal residual disease (MRD) evolution. RQ-PCR (gray) and multiparameter flow cytometry (MFC) (black) quantification of peripheral blood samples at indicated dates. Negative RQ-PCR values are shown as 1E-08, single triplicate BQR results at 1E-07 and 2 or 3 positive triplicates at 1E-06. The horizontal dotted lines represent individual QR and MFC sensitivity, as labeled. Negative MFC results are shown just below 10E-4 (0.01%). RQ-PCR and MFC MRD relapses, respectively, 26 and five months before clinical relapse (A). Pre-emptive treatment based on rising RQ-PCR and/or MFC MRD results (B).

