
Figure 1.
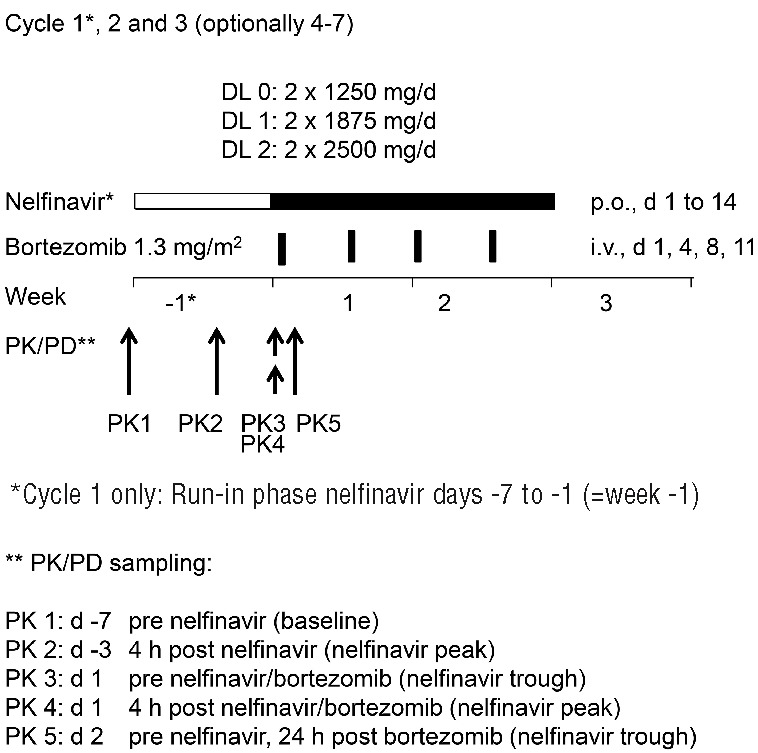
Graphical overview of dosing of nelfinavir (dose levels DL0, DL1, DL2) and bortezomib together with the time points at which samples for pharmakokinetic/pharmakodynamic (PK/PD) analysis were collected (PK1-5). Nelfinavir dosing in week -1 was only performed in cycle 1.