Figure 3.

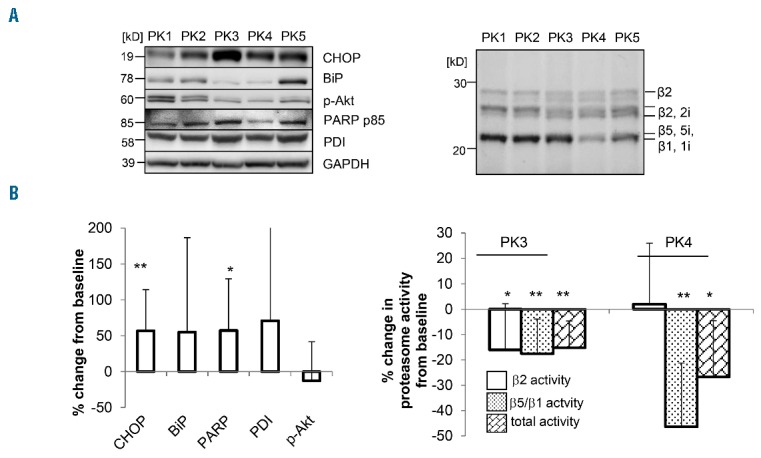
Expression of unfolded protein response (UPR)-related proteins and proteasome activity in peripheral blood mononuclear cells (PBMC) from treated patients PBMC were collected at the indicated time points PK1 (base-line predose), PK2 (nelfinavir 4 h postdose), PK3 (nelfinavir trough + bortezomib pre dose), PK4 (nelfinavir+bortezomib 4 h post dose), PK5 (nelfinavir trough, 24 h post bortezomib). Equal amounts of cellular protein from PBMC was resolved by 12.5% SDS PAGE. (A) exemplary changes in expression of UPR-related protein and proteasome activity in PBMC from one patient (UPN04). Upper left: protein representing the UPR and its related apoptotic machinery (BIP, CHOP, PDI, PARP), as well as pAKT, was assessed from PBMC collected at the time points PK1–PK5, and visualized by western blot, GAPDH served as a control. Upper right: Quantitative comparison of proteasome activity (seperately for the β2-type and β1/β5-type subunits) at the different time points PK1–PK5 was achieved with activity based proteasome probes in the same PBMC samples (see Methods). (B) Mean quantitative changes in expression of UPR-related proteins and proteasome activity in PBMC for all patients Botom left: effect of nelfinavir monotherapy on expression of UPR related protein in PBMC. The relative change in expression of the UPR-associated proteins was assessed for all patients by western blot as (as shown for UPN04 above), and quantified by flourescence scanning comparing the time points PK1 (baseline) versus PK2 (post-nelfinavir); n= 11 patients, one technical failure). The mean relative difference from a base-line signal and standard deviation of expression of the proteins indicated is displayed for PK1 versus PK2. Bottom right: changes in proteasome activity in PBMC for the entire dose escalation cohort are shown after nelfinavir monotherapy (PK1 vs. PK3) and after treatment with nelfinavir in combination with bortezomib (PK1 vs. PK4). The relative changes in proteasome activity in PBMC were quantified using affinity-based probes and flourescence scanning. Mean changes from 11 patients and standard deviation are presented.
