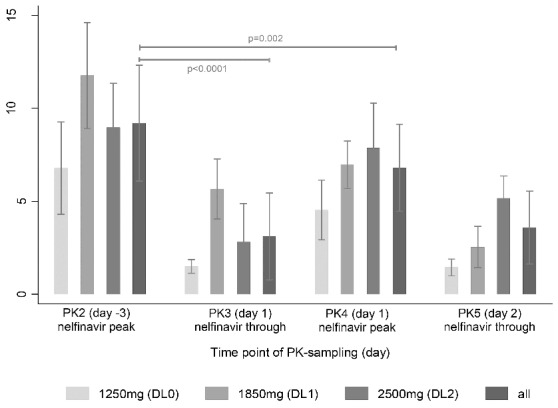
Figure 4.

Mean nelfinavir plasma concentrations (μM) for the 4 pharmacokinetic sampling points and the 3 dosing cohorts (1250, 1850 and 2500 mg bid). Significance levels are given for the difference between mean NFV peak concentration (PK2) and either mean NFV through concnetration (PK3) or NFV peak concentration in combination with BTZ (PK4).
