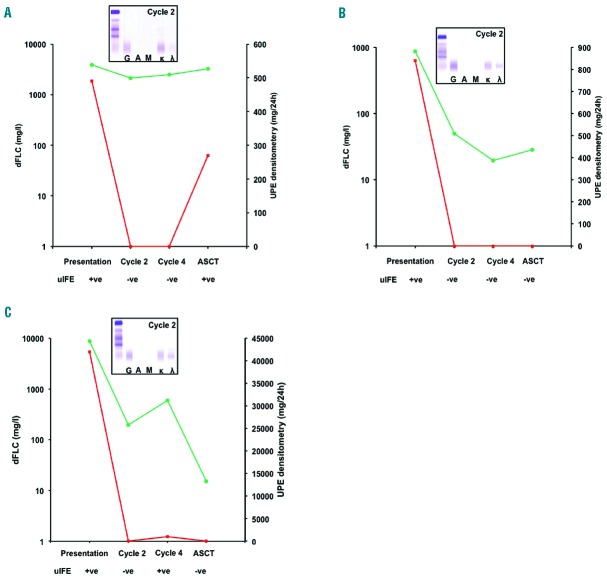
Figure 3.
Case studies of 3 LCMM patients monitored during the course of therapy. At presentation all three patients were UPE and uIFE positive and had abnormal sFLC ratios. In all three patients the sFLC ratio remained abnormal throughout monitoring. (A) dFLC indicated no response to therapy in this κFLC patient. UPE and uIFE became negative at cycle 2; monoclonal bands reappeared post-transplantation, indicating disease progression. (B) and (C) depict two λFLC patients; in both cases dFLC indicated VGPR at the end of cycle 2 whereas UPE and uIFE became negative. In all cases sIFE confirmed the presence of residual disease. dFLC: green lines; UPE: red lines; positive uIFE: +ve; negative uIFE: −ve; inserted gels show sIFE results at the end of cycle 2.

