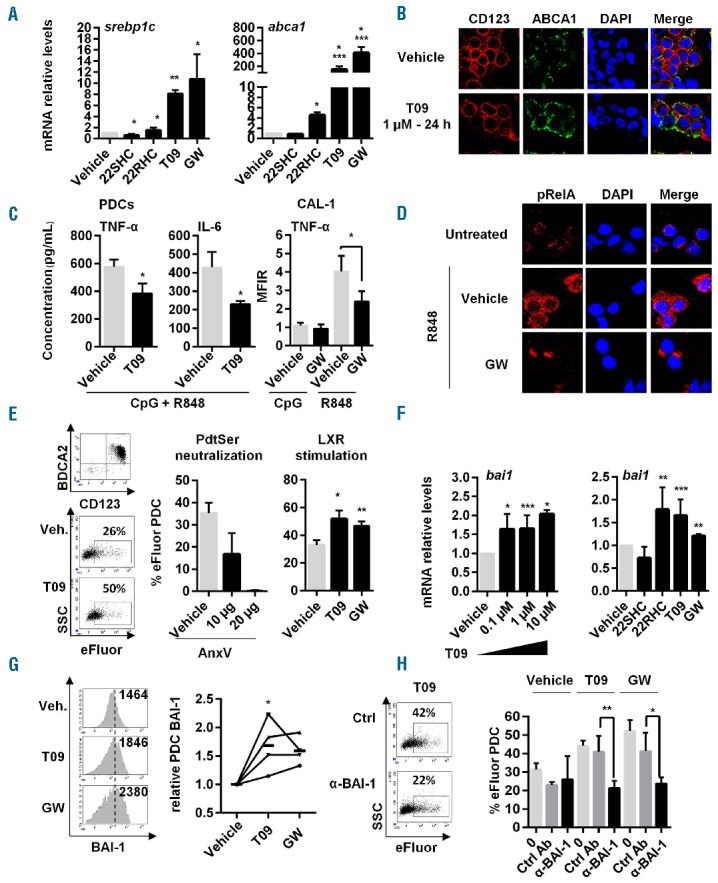
Figure 1.

Stimulation of LXR pathway in PDC inhibits TLR7-induced NF-κB activation, pro-inflammatory cytokine secretion and up-regulates MP internalization via BAI-1. (A) Different LXR agonists, T0901317 (T09), GW3965 (GW), 22RHC or LXR antagonist 22SHC were added (1 μM) to PDC from healthy donors for 24 h and LXR target gene (srebp1c, abca1, lxra [not depicted] data not shown) expression was assessed by qRT-PCR (n=7, meaning PDC isolated from 7 different donors). (B) Freshly isolated PDC were stimulated with 1 μM of T0901317 (T09) for 24 h. Then CD123 and ABCA1 cell surface expression was evaluated by confocal microscopy analysis. Results from a representative experiment out of 3 using PDC from 3 different donors. (C) Freshly isolated PDC (left panels) or PDC cell line CAL-1 cells (right panel) were treated with 1 μM of T0901317 (T09) or GW3965 (GW) for 24 h, followed by a 18-h stimulation using CpG-ODN2216 (CpG, 2 μM) + R848 (1 μg/mL) (left panels) representing TLR9 and TLR7 ligand, respectively, or each ligand separately (right panel). Supernatants were then collected and assessed for TNF-α and IL-6 concentration by multiplex assays (n=5). Intracellular TNF-α levels in CAL-1 cells were also assessed by cytometry. Cumulated mean fluorescent intensity ratio (MFIR=MFI of treated cells/MFI of untreated vehicle cells) is shown (right panel) as mean±S.E.M. of the 5 independent experiments. (D) Freshly isolated PDC were treated for 24 h with 1 μM of GW3965 (GW), followed by TLR7 ligand, R848 (1 μg/mL) for 45 min. Phosphorylation of the NF-κB p65 (pRelA) subunit and its cellular localization were evaluated by confocal microscopy analysis. Results from a representative experiment out of 3 using PDC from 3 different donors. (E) PDC were treated with 1 μM of T0901317 (T09) or GW3965 (GW), washed and cultured with eFluor-labeled MP for 4 h at a 1/40 PDC/MP ratio. MP uptake by PDC was evaluated by measuring eFluor+ PDC by cytometry (n=3). Left panel shows a representative experiment. Middle panel shows that MP uptake requires PdtSer/PdtSer receptor interactions since blockade of these interactions using unlabeled Annexin-V (AnxV at 10 μg or 20 μg) incubated for 30 min with e-Fluor labeled MP decreases the percentage of eFluor+ PDC (n=3). This shows that free eFluor released from MP was not responsible for PDC labeling. (Right) Cumulative data of 3 independent experiments using LXR agonist-treated PDC from 3 different donors expressed as mean±S.E.M. are shown. (F) PDC were treated with increasing concentrations of T09 (0.1 μM, 1 μM or 10 μM) for 24 h (left panel) or LXR agonists, T0901317 (T09), GW3965 (GW), 22RHC or LXR antagonist 22SHC (for a single dose of 1 μM, then bai1 gene expression was quantified by qRT-PCR (n=5). (G) PDC were treated 24 h with 1 μM of T0901317 (T09) and GW3965 (GW) and BAI-1 expression was assessed by cytometry (1 representative experiment out of 4, left panel). Numbers represents mean fluorescent intensity (MFI). Data of 4 independent experiments using PDC from 4 different donors expressed as relative PDC BAI expression obtained using the following formula [% of PDC stained with anti-BAI-1 mAb after treatment] / [% of PDC stained with anti-BAI-1 mAb in vehicle condition], bold lines represent the mean of the 4 experiments (mean±SEM;*P<0.05, Wilcoxon) (right panel). (H) PDC were treated with 1 μM of T0901317 (T09) or GW3965 (GW) for 24 h. Then, cells were cultured for 1 h with neutralizing anti-BAI-1 antibody (α-BAI-1) or irrelevant control antibody (Ctrl Ab), before adding eFluor-labeled MP for 4 h and analyzing by cytometry (n=4). Dot plot from one experiment representative of 4 (left panel). Cumulative data of 4 independent experiments expressed as mean±S.E.M. of eFluor+ PDC are shown. Unless specified, all data were expressed as mean±S.E.M. from n independent experiments. *P<0.05, **P<0.001, ***P<0.005 (Mann-Whitney).
