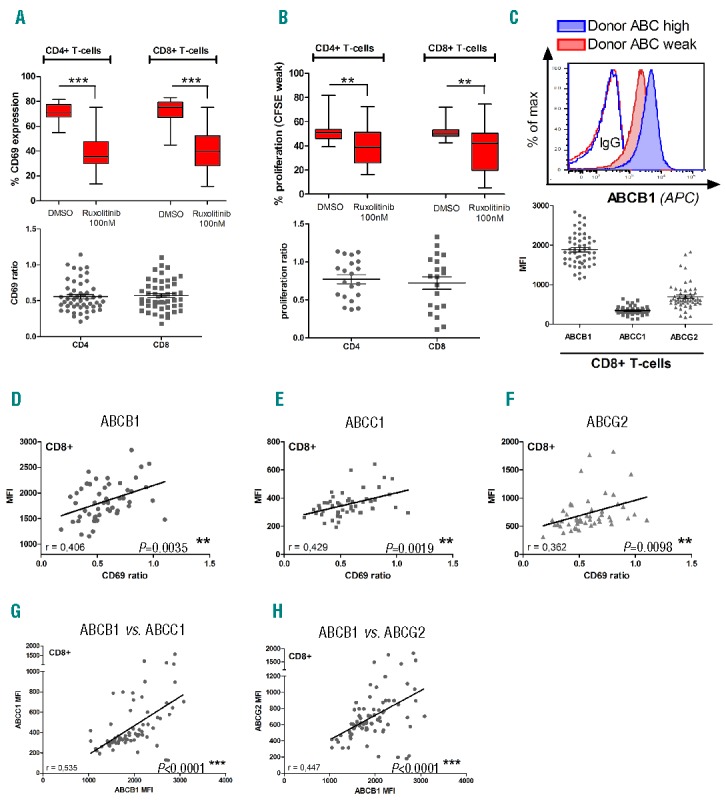
Figure 2.

ABC-transporter expression predicts the degree of cytotoxic T-cell impairment after RUX treatment in healthy donor samples. (A) T-cell activation measured by CD69 expression upon RUX treatment in CD4+ and CD8+ T-cells. PBMCs were isolated from healthy donor peripheral blood by Ficoll, treated with RUX (100 nM) and subsequently stimulated with PHA (0,5%) or DMSO (soluble control). After 24h of incubation cells were analyzed by flow cytometry (CD3, CD4, CD8, CD69, ABCB1, ABCC1, ABCG2, SYTOX®Blue Dead Cell Stain). The CD69 ratio for each donor (bottom panel) was calculated from the absolute values for CD69 expression (top panel) after DMSO or RUX treatment. Statistical analysis was performed using Wilcoxon matched-pairs test (n=50; *P<0.05, **P<0.01, ***P<0.001). (B) T-cell proliferation was measured using CellTrace™ CFSE assay in CD4+ and CD8+ cells after RUX treatment (100 nM RUX, 0,5% PHA, 50 IU/ml IL2, 5 d of incubation, statistics: Wilcoxon matched-pairs test – n=20). (C) After staining T-cells with ABCB1 flow antibody a clear peak-shift between ABC “high” or “weak” expressing donors could be observed (top panel). (D,E,F) Correlation between ABC-transporter expression and CD69 ratio (experimental setting as described in A) in CD8+ T-cells. The mean fluorescence intensity (MFI) of ABCB1 (D), ABCC1 (E) and ABCG2 (F) has been correlated to the degree of T-cell inhibition (CD69 ratio) after in vitro RUX treatment. (G,H) Surface expression of ABCB1 and ABCC1 (G) as well as ABCB1 and ABCG2 (H) were correlated with each other. Statistical analysis has been performed using Pearson correlation (n=50; Pearson correlation coefficient and P-value indicated in the diagrams).
