Figure 1.
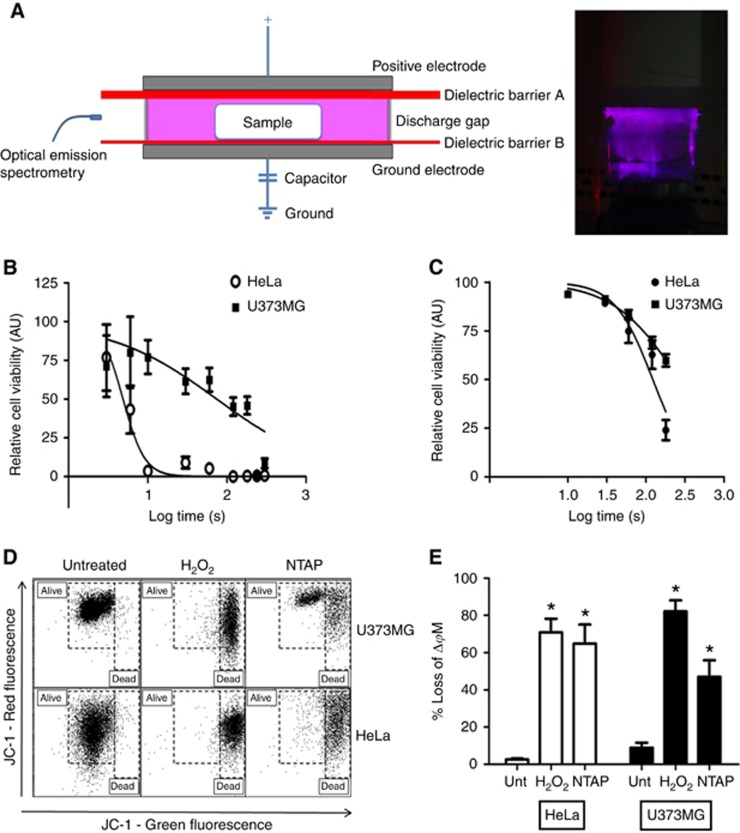
NTAP dose-dependent cytotoxicity of HeLa and GBM cells. (A) Schematic of the DBD-NTAP set-up used in this study, and a photograph showing plasma generation which fluoresces in the presence of helium gas. (B) Both U373MG cells and HeLa cells were exposed to NTAP at 75 kV for up to 5 min. Forty-eight hours later, the cells were analysed using the Alamar Blue cell viability assay. All experiments were repeated a minimum of three times. Statistical analysis was carried out using non-linear regression analyses. (C) Both U373MG cells and HeLa cells were exposed to NTAP at 75 kV for up to 180 s. HeLa cells were trypsinised and counted using a haemocytometer 48 h post treatment. U373MG cells were analysed 96 h post treatment. All experiments were repeated a minimum of three times. Statistical analysis was carried out using non-linear regression analyses. (D) HeLa and U373MG cells were exposed to NTAP at 75 kV for 3 min. After a 48-h incubation period, cells were loaded with 1 μg ml−1 JC-1 dye and analysed by flow cytometry. Data shown depict apoptosis measured by quantitative shifts in the ΔΨm (red to green) fluorescence intensity ratio before and after H2O2 and NTAP expsoure. All experiments were repeated in triplicate. Statistical analysis was carried out using one-way ANOVA with Tukey's multiple comparison post-test (*P<0.05). A full colour version of this figure is available at the British Journal of Cancer journal online.

