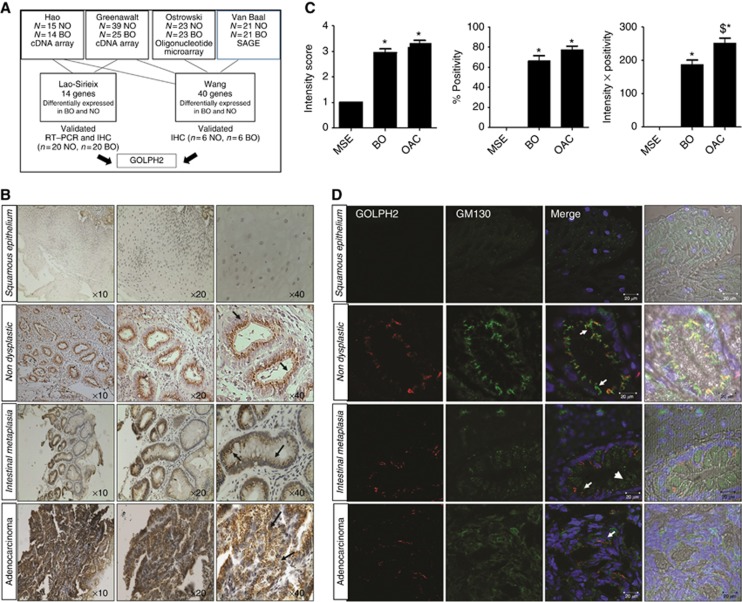
Figure 1.
(A) Identification of candidate Golgi-associated proteins involved in oesophageal cancer progression. An in silico analysis-based approach was used to identify potential candidate Golgi-associated proteins from two meta-analysis studies (Lao-Sirieix et al, 2009, Wang et al, 2009) which analysed four publicly available microarray data sets of genes differentially expressed in Barrett's oesophagus and normal oesophagus. Lao-Sirieix et al (2009) undertook a meta-analysis study of gene-expression microarray data sets, in two data sets ((Hao et al, 2006; Greenawalt et al, 2007). Independent validation was performed by both RT–PCR and IHC (n=20 Normal and n=20 Barrett's oesophagus) and 14 genes were verified to be statistically significantly overexpressed in Barrett's tissue compared with normal tissue (Lao-Sirieix et al, 2009). Wang et al, (2009) statistically analysed 4 data sets (Van Baal et al, 2005; Hao et al, 2006; Greenawalt et al, 2007; Ostrowski et al, 2007) and identified 40 genes common across the 4 data sets, independently validated by IHC on normal oesophagus and BO patient tissue (n=6 Normal, n=6 BO). GOLPH2 was identified as one of these candidate genes common to both of these meta-analyses studies. (B) GOLPH2 localisation in oesophageal tissue. Immunohistochemistry was used to identify GOLPH2 in tissue from patients with adenocarcinoma using an anti-GOLPH2 antibody (arrows). Images represent Squamous epithelium, non-dysplastic glands (from normal oesophagus n=6), Barrett's intestinal metaplasia (n=13) and oesophageal adenocarcinoma (n=15 identified by a consultant histopathologist (SF)). (C) Graphs represent expression intensity levels, % Positivity and Intensity × Positivity (Left to Right, respectively) in Barretts oesophagus (BO), oesophageal adenocarcinoma (OAC) and matched squamous epithelium (MSE) (*P<0.05 vs MSE, $P<0.05 vs BO). (D) Immunofluorescence images representing the typical localisation of GOLPH2 observed in squamous epithelium tissue, non-dysplastic glands, Barrett's intestinal metaplasia and adenocarcinoma. Golgi structure was identified using an antibody to the cis-Golgi-network protein GM130 (green, arrowheads), GOLPH2, using an anti-GOLPH2 antibody (Red, arrows) and nuclei using Hoechst (blue). Images were acquired using a Zeiss LSM510 laser confocal microscope.

