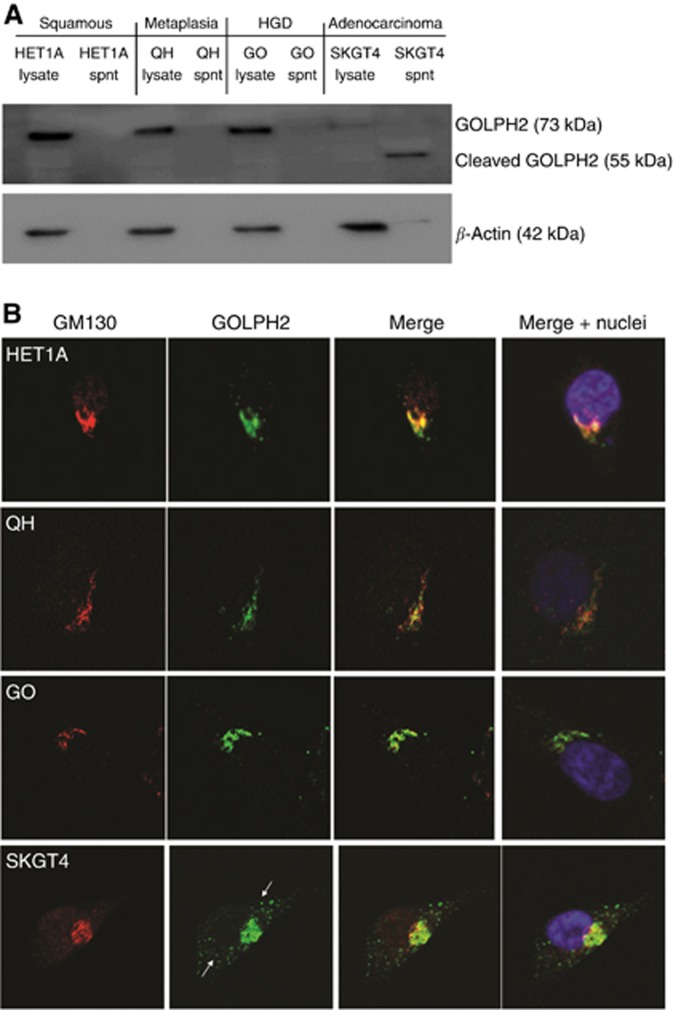
Figure 2.
GOLPH2 expression in oesophageal cell lines. (A) Basal levels of GOLPH2 expression and secretion in whole cell lysates or supernatants were analysed by western blot. (B) Localisation of GOLPH2 was identified using antibodies specific to GOLPH2 (green) and the cis-Golgi-network marker GM130 (Red). Nuclei were identified with Hoechst (Blue). Arrows indicate cytoplasmic vesicles containing GOLPH2 (Green). Images were acquired using a Zeiss LSM510 laser confocal microscope.

