
Figure 2.
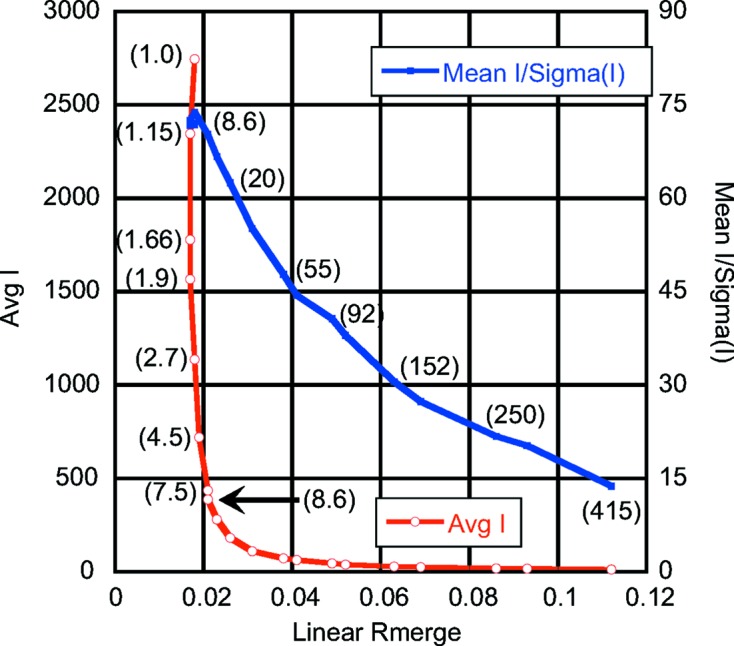
Data sets of crystalline lysozyme collected as a function of attenuation. Selected attenuation values are shown in parentheses. The highest attenuation factor (415) corresponds to the lowest average (I) (open circles) and lowest mean (I)/σ(I) (solid points). As the attenuation factor decreases, the linear R merge decreases proportionately to the increase in statistics. When the average (I) reaches ∼720 for the data set, mean (I)/σ(I) plateaus near a value of 72. Beyond this point, very little change occurs in linear R merge, regardless of the increase in average (I).