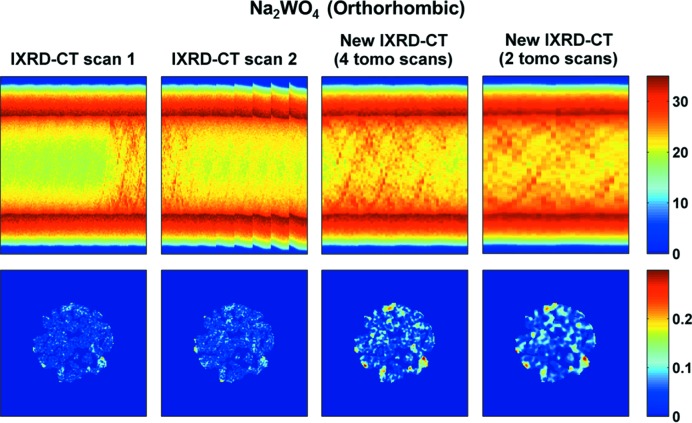
Figure 14.
Sinograms and reconstructed images of the orthorhombic Na2WO4 phase using different IXRD-CT data sets. First column: IXRD-CT scan 1. Second column: IXRD-CT scan 2. Third column: the new IXRD-CT data set derived by combining tomo scans 7 and 8 from IXRD-CT scan 1 and tomo scans 1 and 2 from IXRD-CT scan 2. Fourth column: the new IXRD-CT data set derived by combining tomo scan 8 from IXRD-CT scan 1 and tomo scan 1 from IXRD-CT scan 2.

