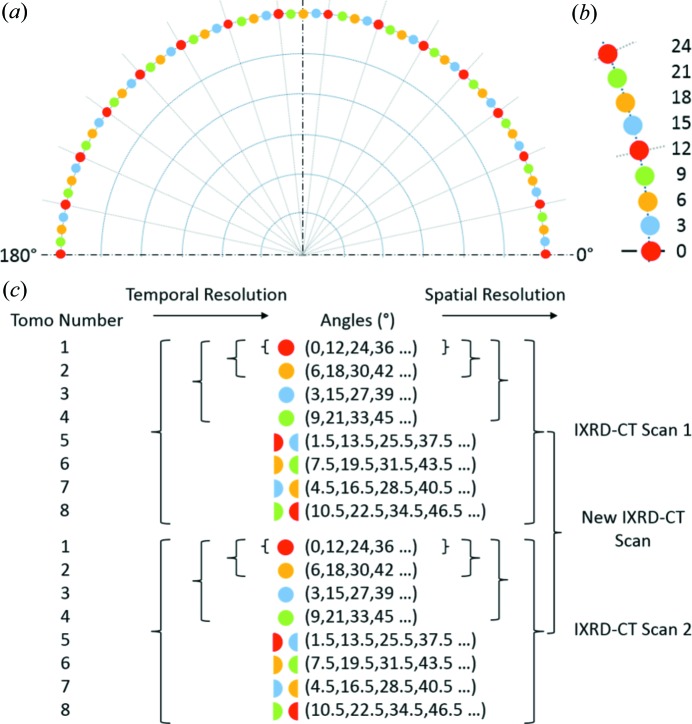
Figure 3.
(a) A schematic representation of a continuous traverse IXRD-CT scan consisting of eight XRD-CT scans. (b) An expanded section of part (a), showing the angular positions of the individual XRD-CT scans. (c) A demonstration of how the spatiotemporal resolution changes in the IXRD-CT scan and the possible combinations of individual data sets.

