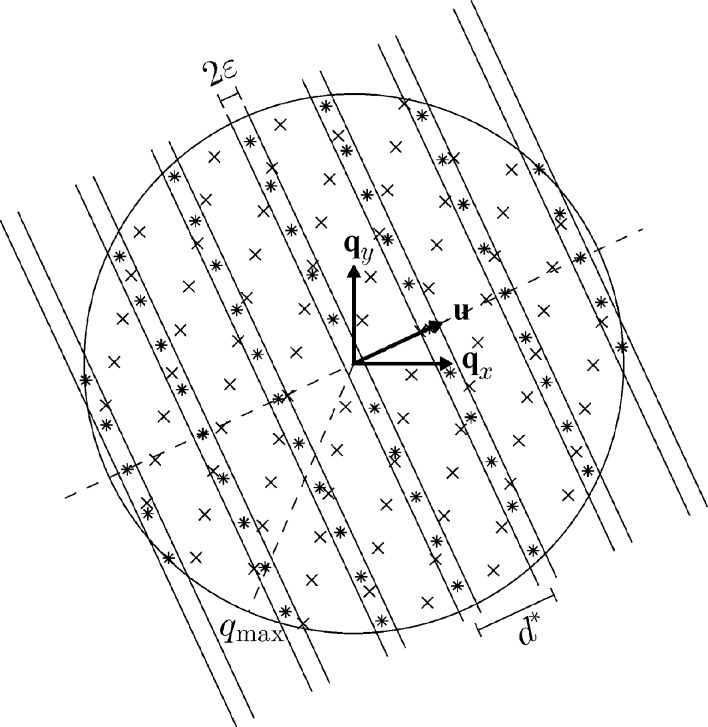
Figure 2.
Illustration of the first step in the algorithm. For ease of visualization a two-dimensional slice through the center of reciprocal space is shown. We assume data are available up to a certain q
max. The symbols * and × mark reflections from two grains. For a given direction  , the lattice spacing d* is varied and the maximum number of reflections within the strips of fixed width 2∊ are counted.

