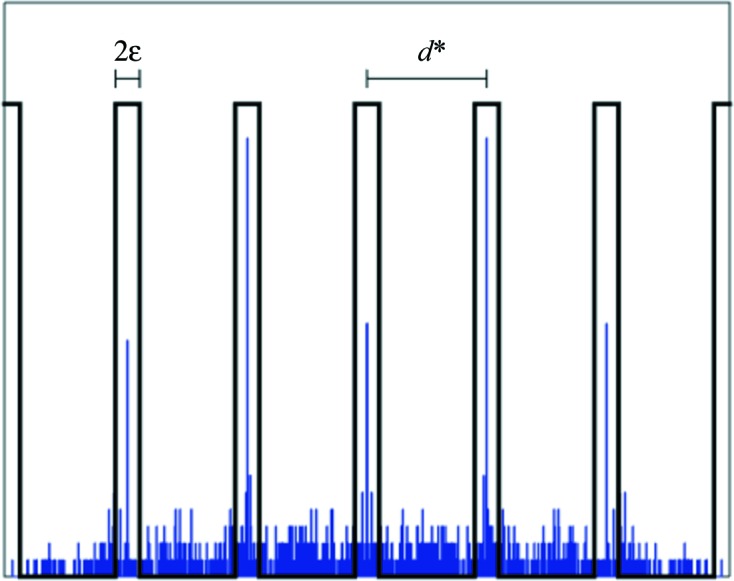
Figure 3.

Illustration of the filter used to count reflections. The histogram is an example of the projection of the experimental data onto the line defined by  (cf. Fig. 2 ▸). The filter comprises a set of box functions of fixed width 2∊ and distance between box centers d*.
