Figure 1.
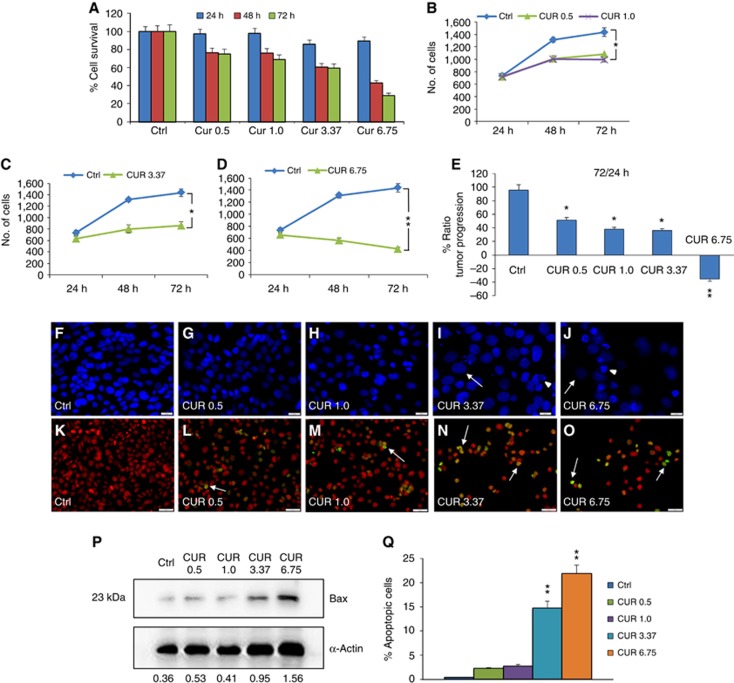
Curcumin influences PE/CA-PJ15 tumour progression and apoptosis. (A–D) Graphs (mean±s.e.m.) showing percentage of cell survival (A) and tumour progression (B–D) at 24, 48 and 72 h after curcumin treatment. (E) Histogram showing the magnitude of tumour progression between 24 and 72 h, expressed as the percentage of the ratio of the number of cells counted at 72 and 24 h. *P<0.05; **P<0.001. (F–J) Representative images of DAPI-stained cells treated with curcumin: changes in morphology are indicated by arrows (swelling) and arrowheads (nuclear condensation and cellular fragmentation). Scale bar: 20 μm. (K–O) Representative images of terminal deoxynucleotidyl transferase dUTP nick end labeling (TUNEL) assay in PE/CA-PJ15 treated with different curcumin doses. Arrows indicative of apoptotic cells. Scale bar: 50 μm. (P) Western blot for Bax activation. Data are normalised to actin values. (Q) Bar graph shows the mean values (mean±s.e.m.) of apoptotic cells for each condition; *P<0.05; **P<0.001. Data are representative of three independent experiments; each count performed on 10 fields randomly selected for each experimental condition and each time point.

