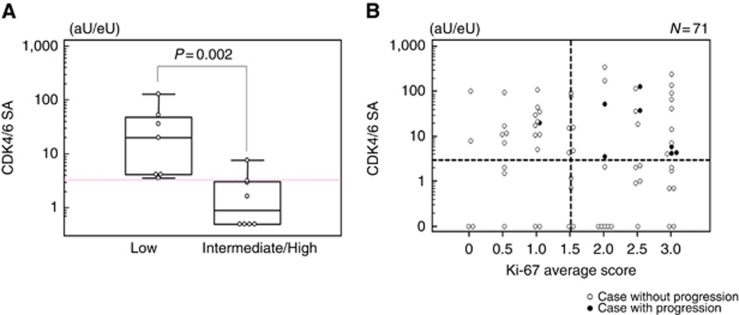
Figure 1.
CDK4/6SA in low-risk and intermediate-/high-risk patients, and its association with Ki-67 expression. (A) Discordance of CDK4/6SA between low-risk and intermediate-/high-risk groups. Statistical analysis was performed using Mann–Whitney's U-test. (B) Scatter diagram of CDK4/6SA and the average Ki-67 expression score in low-risk patients.

