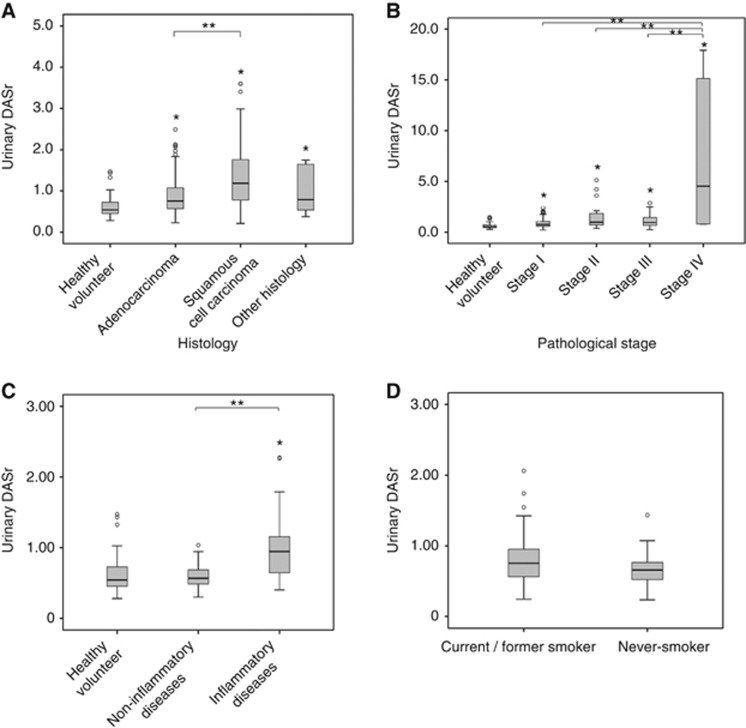
Figure 1.
Comparison of urinary DASr level according to various status. (A) A box plot showing the urinary DASr levels in healthy controls and patients with non-small-cell lung cancer classified according to tumour histology. *P<0.05 vs healthy controls, **P<0.05 between the indicated groups. (B) A box plot showing the urinary DASr in healthy controls and patients with non-small-cell lung cancer classified according to clinical staging. *P<0.05 vs healthy controls, **P<0.05 between the indicated groups. (C) A box plot showing the urinary DASr in healthy controls and patients with benign lung or pleural diseases. *P<0.05 vs healthy controls, **P<0.05 between the indicated groups. (D) A box plot showing the urinary DASr in patients with non-small-cell lung cancer classified according to smoking status. A comparison using the Mann–Whitney U-test demonstrated no significant differences (P=0.950).

