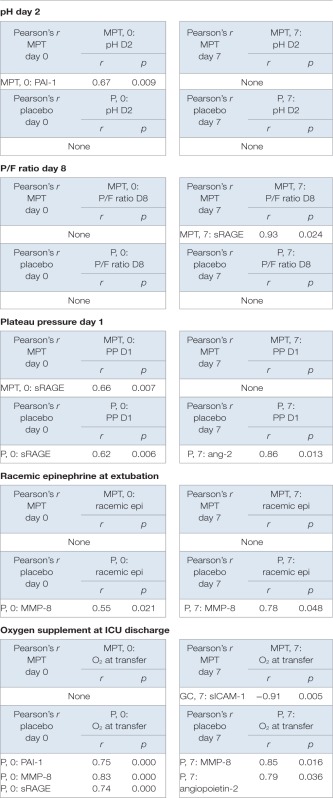
Table 2.
Pearson’s correlation table showing pairwise comparisons of clinical parameters of diseases and other factors.
 |
r is the Pearson’s correlation coefficient. A p-value of <0.05 was considered significant and was derived from a paired, two-tailed t-test. MPT group (day 0: biomarkers n = 14–15 and clinical parameters n = 17 and day 7: biomarkers n = 7 and clinical parameters n = 8). Placebo group (day 0: biomarkers n = 16–18 and clinical parameters n = 18 and day 7: biomarkers n = 7 and clinical parameters n = 7).
