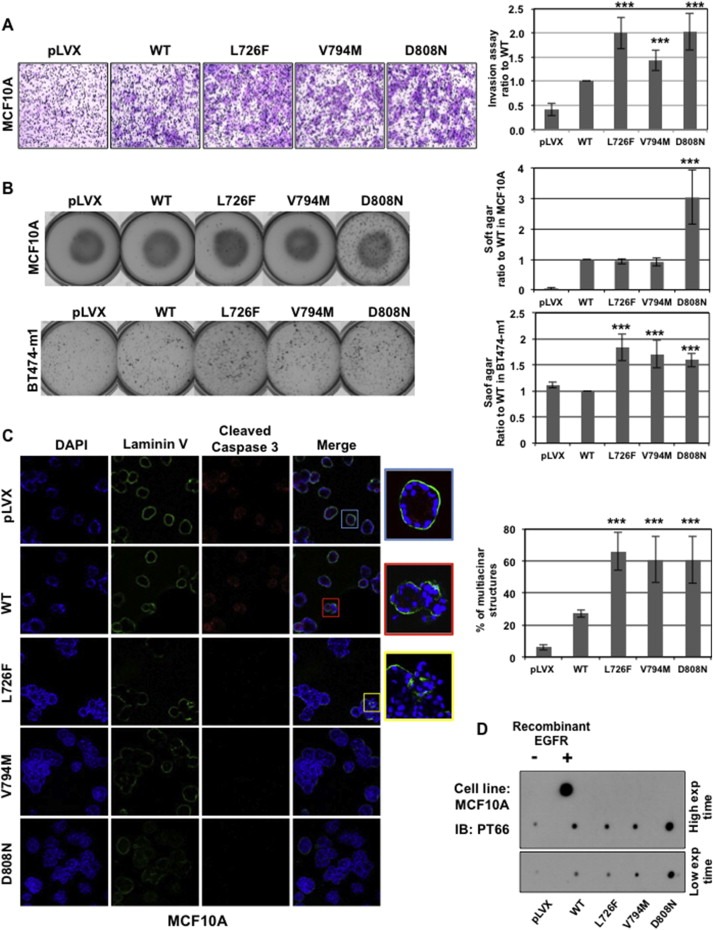
Figure 2.

HER2 mutants induce a more aggressive phenotype. A) HER2 mutants increase MCF10A cell invasion. The graph (right panel) shows the proportion of HER2‐wt and L726F cells compared with control (mean value of 3 separate experiments) (***, p < 0.001). B) HER2 mutants increase anchorage independence. MCF10A (upper panel) or BT474‐m1 (lower panel) cells grown in soft agar were stained and counted (graphs) (***, p < 0.001). C) HER2 mutants impair formation of normal acini by MCF10A. The immunofluorescence experiment was performed on fixed acini using DAPI (blue), anti‐laminin V (green), and anti‐cleaved‐caspase 3 (red), and photos were taken using confocal microscopy (lower panel). Graph: Expression of the mutants correlates with an increase in the number of abnormal “grape‐like” multicentric acini formed by MCF10A cells. D) HER2 mutants have a similar or stronger kinase activity then HER2‐wt. Kinase assay was performed in vitro using c‐myc pulled‐down HER2‐wt and mutants (from MCF10A cells) on a non‐specific peptide. The resulting product was dot blotted onto a nitrocellulose membrane and labeled with PT66 phosphotyrosine targeting antibody. Gray levels were analyzed using NIH Image J software and normalized to 1 arbitrarily given the HER2‐wt.
